
FIGURE
Fig. 5
- ID
- ZDB-FIG-231102-58
- Publication
- Sun et al., 2023 - Exposure to PFOA and its novel analogs disrupts lipid metabolism in zebrafish
- Other Figures
- All Figure Page
- Back to All Figure Page
Fig. 5
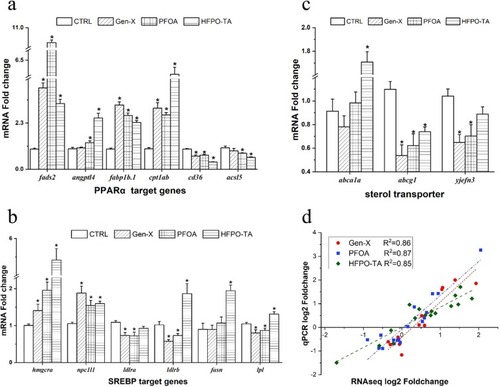
RT-qPCR analysis after 72 hpe exposure of PFOA and alternatives to zebrafish. (a) mRNA expression levels of representative target genes downstream of PPARα; (b) mRNA expression levels of representative target genes downstream of SREBP; (c) mRNA expression levels of sterol transport-related factors; (d) represents the correlation analysis between RNA-seq gene expression level and RT-qPCR, and the adjusted R2 was Gen-X 0.86, PFOA 0.87, HFPO-TA 0.85. n = 5, 30 zebrafish per group; * P < 0.05 compared with control group; data are expressed as mean ± SE. |
Expression Data
| Genes: | |
|---|---|
| Fish: | |
| Conditions: | |
| Anatomical Term: | |
| Stage Range: | Protruding-mouth to Day 5 |
Expression Detail
Antibody Labeling
Phenotype Data
| Fish: | |
|---|---|
| Conditions: | |
| Observed In: | |
| Stage Range: | Protruding-mouth to Day 5 |
Phenotype Detail
Acknowledgments
This image is the copyrighted work of the attributed author or publisher, and
ZFIN has permission only to display this image to its users.
Additional permissions should be obtained from the applicable author or publisher of the image.
Full text @ Ecotoxicol. Environ. Saf.