|
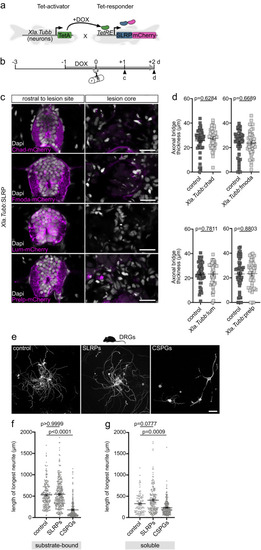
SLRPs do not directly act on neurons to inhibit axon regeneration. a Strategy to achieve neuron-specific expression of slrp-mCherry fusions using the TetON system. b Schematic timeline of the experimental design using the TetON system. c Neuron-specific induction of indicated slrp-mCherry fusions in Xla.Tubb:TetA;TetRE:SLRP-mCherry (short Xla.Tubb:SLRP) transgenic zebrafish leads to negligible mCherry fluorescence (magenta) in the lesion core. Note that the lesion core lacks neuronal somata. Also note that strong mCherry fluorescence (magenta) is detectable in intact spinal cord tissue rostral to the lesion core. The same results were obtained in n ≥ 10 animals for each experimental condition. Images shown are transversal views of the unlesioned trunk or lesion site (dorsal is up). d Neuron-specific induction of chad, fmoda, lum, or prelp in Xla.Tubb:SLRP transgenic zebrafish does not reduce the thickness of the axonal bridge. Each data point represents one animal. Two-tailed Mann-Whitney test. ncontrol = 45, nChad = 45; ncontrol = 45, nFmoda = 45; ncontrol = 47, nLum = 45; ncontrol = 46, nPrelp = 44 animals over three independent experiments. e–g Neurite outgrowth of primary adult murine dorsal root ganglion (DRG) neurons is not reduced in the presence of human SLRP proteins (mixture of CHAD, FMOD, LUM, PRELP), as compared to controls. Neurite growth is significantly reduced in the presence of CSPGs. f DRGs were cultured on glass coverslips with substrate-bound laminin, laminin and SLRPs, or laminin and CSPGs. g DRGs were cultured on laminin-coated glass coverslips and growth medium was supplemented with either SLRPs, CSPGs, or solvent control. Each data point represents one DRG neuron. Kruskal-Wallis test followed by Dunn’ multiple comparison. ncontrol = 229, nSLRPs = 321, nCSPGs = 315 (f); ncontrol = 100, nSLRPs = 194, nCSPGs = 266 (g). The experiment was repeated once. a–g Data are means ± SEM. Scale bars: 100 µm (e), 20 µm (c). d days, dpl days post-lesion, DOX doxycycline. The mouse icon in the panel was created using BioRender. Source data are provided as a Source Data file.
|

