|
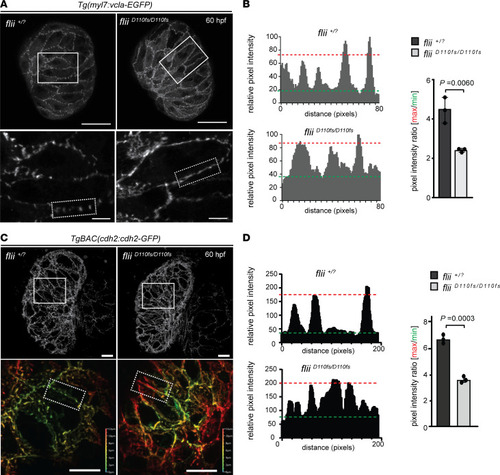
Flii-deficient zebrafish exhibit defects in vinculin-EGFP and cadherin2-EGFP localization. (A) 3D confocal projections of 60 hpf Tg(myl7:vcla-EGFP) flii+/? sibling and fliiD110fs/D110fs cardiac ventricles. Vinculin-EGFP expression is restricted to the lateral membranes. Note that vinculin-EGFP expression is concentrated into foci in siblings but appears more diffuse in fliiD110fs/D110fs zebrafish (magnifications shown in lower panel); each group, n = 5. Scale bars: projections, 25 μm; magnifications, 5 μm. (B) Plots of the relative pixel intensity along membranes from dotted boxed areas of A. Green and red dotted lines correspond to average minimum and maximum relative pixel intensities, respectively. Quantification of pixel intensity ratios is shown on the right. Unpaired t test; values represent means ± SEM; each group, n = 3. (C) Representative 3D views of 60 hpf TgBAC(cdh2:cdh2-EGFP)flii+/? sibling (left panels) and fliiD110fs/D110fs cardiac ventricles (right panels). Magnifications show a clear punctate localization of cadherin2-EGFP in wild-type controls that is lacking in fliiD110fs/D110fs embryos (Z-plane position color coded as indicated); each group n = 5. Scale bars: projections, 10 μm; magnifications, 10 μm. (D) Plots of the relative pixel intensity along membranes from dotted boxed areas of C. Green and red dotted lines correspond to average minimum and maximum relative pixel intensities, respectively. Quantification of pixel intensity ratios is shown on the right. Unpaired t test; values represent means ± SEM; n = 3 for each genotype.
|