
FIGURE
Figure 6
- ID
- ZDB-FIG-231002-305
- Publication
- Qiao et al., 2023 - In-Depth Analysis of the Mechanism of Astaxanthin Succinate Diester in Reducing Ulcerative Colitis in C57BL/6J Mice Based on Microbiota Informatics
- Other Figures
- All Figure Page
- Back to All Figure Page
Figure 6
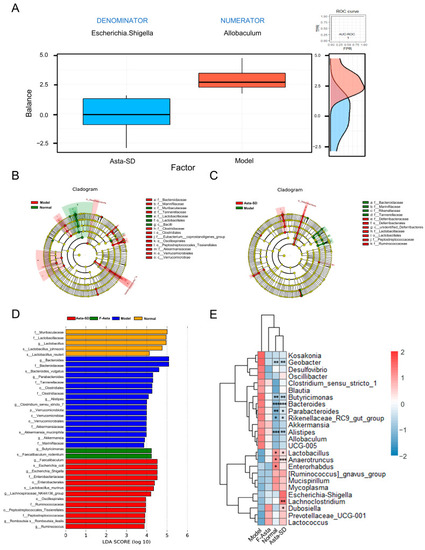
Asta-SD-regulated gut microbial structure and composition of UC mice. ( |
Expression Data
Expression Detail
Antibody Labeling
Phenotype Data
Phenotype Detail
Acknowledgments
This image is the copyrighted work of the attributed author or publisher, and
ZFIN has permission only to display this image to its users.
Additional permissions should be obtained from the applicable author or publisher of the image.
Full text @ Molecules