Study design for the whole experiment. The chemical structure of free astaxanthin (F-Asta) and astaxanthin succinate diester (Asta-SD) are presented in panel (A). C57BL/6J mice were provided with water or 3% DSS-containing water for 7 d (B). On days 0–7, mice were orally administered with PBS or 50 mg kg−1 of F-Asta, Asta-SD.

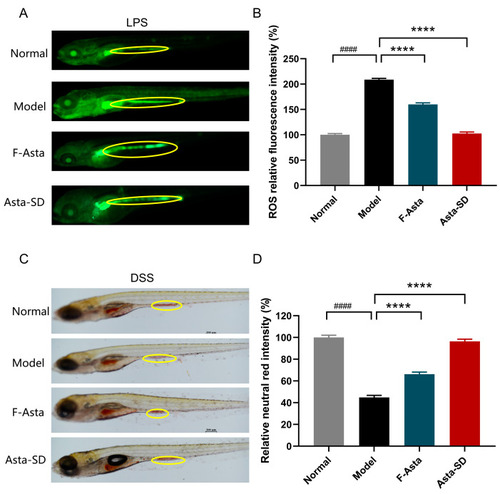
Inflammation inhibitory effect of astaxanthin succinate diester (Asta-SD) in zebrafish. (A) Quantification of the ROS levels induced by LPS, which were measured after staining with DCF-DA by image analysis and fluorescence microscopy. (B) Zebrafish fluorescence intensity using image J. (C) Quantification of neutral red images: injury in zebrafish intestines. (D) Neutral red accumulation. The values are expressed as the mean ± SEM, n = 10. #### p < 0.0001, **** p < 0.0001.

In vivo therapeutic outcomes of Asta-SD against UC. (A) Bodyweight in each group. (B) Kinetics of daily disease activity index (DAI) scores throughout the entire duration of the study. (C) Colon length. (D) Photographs of colons. (E) Colon index. Data were means ± SEM. (n = 6; * p < 0.05, ** p < 0.01, *** p < 0.001, and **** p < 0.0001; ANOVA followed by a Bonferroni post hoc test).

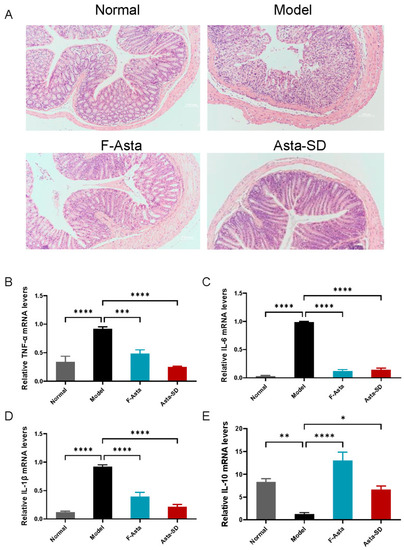
Astaxanthin succinate diester improves inflammation in UC mice. (A) Representative hematoxylin-and-eosin-stained (H&E-stained) distal colon sections. Gene expression levels of inflammatory factors: (B) TNF-α; (C) IL-6; (D) IL-1β; (E) IL-10. Data were means ± SEM. (n = 6; * p < 0.05, ** p < 0.01, *** p < 0.001, and **** p < 0.0001; ANOVA followed by a Bonferroni post hoc test).

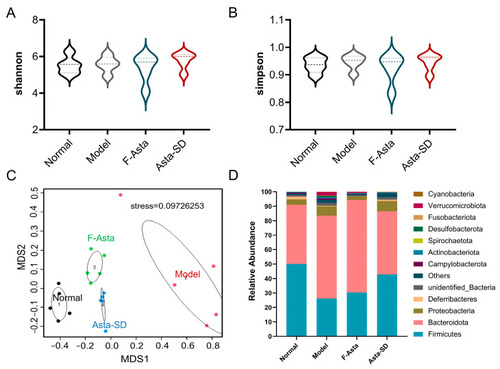
Asta-SD-regulated gut microbial structure and composition of DSS mice. The community diversity of gut microbiota (Shannon (A) and Simpson (B) index). (C) Nonmetric multidimensional scaling (NMDS) analysis based on Aitchison distance. (D) Bacterial taxonomic profiling at the phylum level.

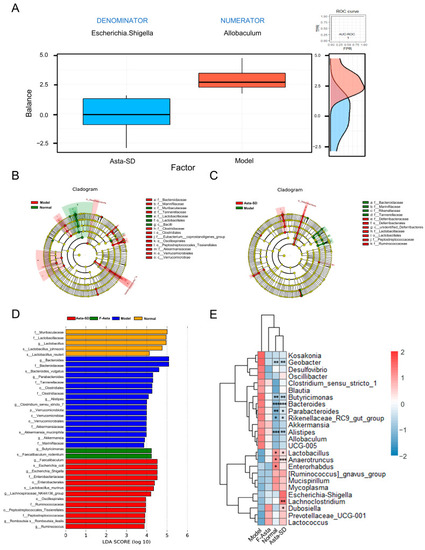
Asta-SD-regulated gut microbial structure and composition of UC mice. (A) The boxplot shows the distribution of the balance scores for the Model and Asta-SD groups. The ROC curve and the density plot are presented on the right side. (B,C) LEfSe evolutionary branching diagram. (D) Histogram of LDA value distribution (LDA > 3.5). (E) The heatmap illustrating gut microbial changes at the genus level for Normal and Asta-SD groups compared with the Model group (* p < 0.05, ** p < 0.01, *** p < 0.001).

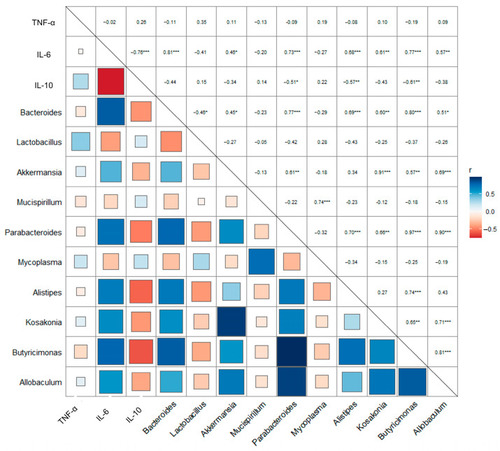
Pearson correlation analysis between pro-inflammatory cytokines and microbial communities at the genus. (* p < 0.05, ** p < 0.01, *** p < 0.001).

Acknowledgments
This image is the copyrighted work of the attributed author or publisher, and ZFIN has permission only to display this image to its users. Additional permissions should be obtained from the applicable author or publisher of the image. Full text @ Molecules