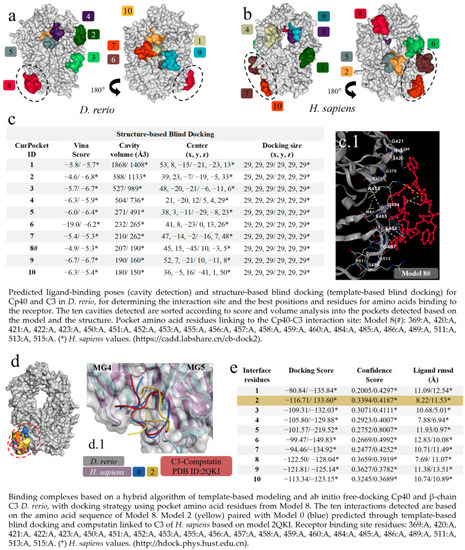
Virtual screening for the detection of the best D. rerio Cp40–C3 interaction. (a) Docking shows the specific interaction (Model 8, in red) between Cp40 and the active site, as well as between the MG4 and MG5 domains of the D. rerio C3 β chain. Other interactions/models outside the circle are unspecific links; (b) H. sapiens C3 β chain docking showing two model-specific interactions (7 and 10) and other non-specific bindings; (c) shows the top ten interactions based on cavitation and blind docking; (*) represents H. sapiens values and (#) shows model 8#, selected according to position associated with the Cp40 activity site and the compstatin 2QKI crystallographic model. (c.1) Interaction of Cp40 with the main C3 binding amino acid residues in the orthosteric binding pocket between the MG4 and MG5 domains of Model 8#. (d) Docking based on the amino acid sequence of Model 8 (d.1) shows three interactions: model 0 (blue), based on prediction according to template-based blind docking; compstatin linked to C3 of H. sapiens (red), based on model 2QKI; and model 2 (yellow), chosen from the positions and values shown in the (e). The chains overlap between H. sapiens (purple) and D. rerio (grey), and the MG4 and MG5 domains distinguish the two domains. The numeric sequences refer to the colors that represent each docking interaction model.
|
