|
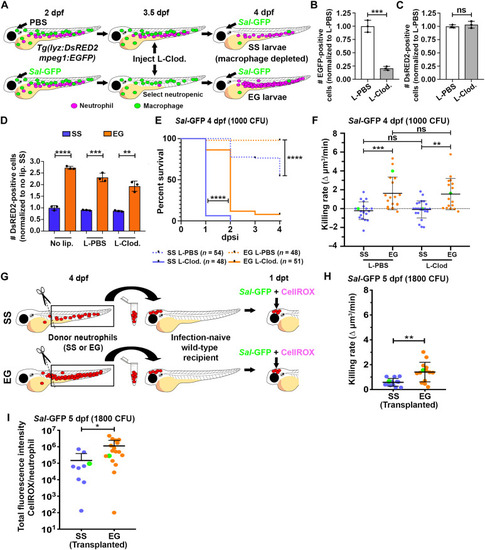
EG neutrophils maintain elevated killing rates in macrophage-depleted larvae and when transplanted into infection-naïve recipients. (A) Schematic illustrating strategy to deplete macrophages within SS and EG larvae. (B and C) Flow quantification of EGFP-expressing macrophages (B) and DsRED2-expressing neutrophils (C) from whole 4 dpf Tg(lyz:DsRED2;mpeg1:EGFP) larvae, following liposomal-clodronate (L-Clod) injection, compared to liposomal-PBS (L-PBS) injection controls (n = 20 larvae per sample, three experimental replicates). (D) Flow quantification of DsRED2-expressing neutrophils from whole 4 dpf SS and EG Tg(lyz:DsRED2;mpeg1:EGFP) larvae, 1 day following L-Clod. injection, compared to L-PBS injection and no liposome (no lip.) controls (n = 20 larvae per sample, three experimental replicates). (E) Kaplan-Meier graph showing survival of SS L-PBS, SS L-Clod., EG L-PBS, and EG L-Clod. larvae over 4 dpsi with Sal-GFP at 4 dpf. (F) Bacterial killing rates of SS and EG neutrophils within L-Clod.– and L-PBS–injected Tg(lyz:DsRED2;mpeg1:EGFP) larvae following Sal-GFP infection. Green data points highlight killing rates of neutrophils as shown in fig. S4C. (G) Schematic illustrating transplantation of FACS-isolated SS and EG neutrophils into infection-naïve recipient larvae. (H) Bacterial killing rates of transplanted SS and EG neutrophils following Sal-GFP infection. Green data points highlight killing rates of neutrophils as shown in fig. S4D. (I) Quantification of ROS production within Sal-GFP-laden transplanted SS and EG neutrophils, as detected by CellROX fluorescence. Green data points highlight ROS production of neutrophils as shown in fig. S4E. Error bars, mean ± SD; *P < 0.05, **P < 0.01, ***P < 0.001, ****P < 0.0001; unpaired Student’s t test (B, C, D, H, and I), Gehan-Breslow-Wilcoxon test (E), and one-way ANOVA with Tukey’s multiple comparisons test (F).
|