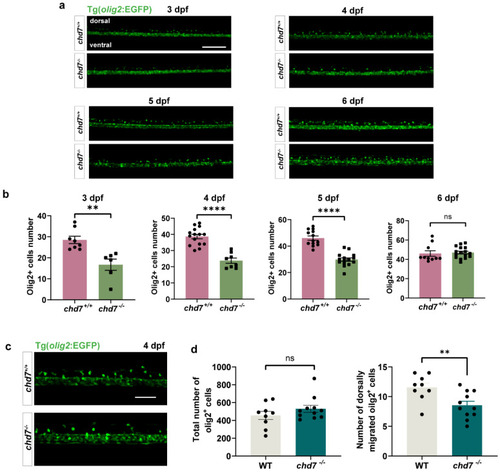
Chd7 knockout suppressed OPC migration. (a) Representative image of dorsally migrated olig2+ cells at 3, 4, 5, and 6 dpf between chd7+/+ and chd7−/− groups. Scale bar: 100 μm. (b) The number of dorsally migrated olig2+ cells at 3, 4, 5, and 6 dpf decreased in chd7−/− group. Data shown as mean ± sem. 3 dpf, ** p = 0.0023; 4 dpf, **** p < 0.0001; 5 dpf, **** p < 0.0001; 6 dpf, p = 0.7349, ns: not significant, unpaired Student’s two-tailed t-test. (c) Representative image of total and dorsally migrated olig2+ cells at 4 dpf between chd7+/+ and chd7−/− group. Scale bar: 10 μm. (d) The number of total olig2+ cells at 4 dpf did not differ significantly between the two groups, ns: not significant. The number of dorsally migrated olig2+ cells at 4 dpf decreased in chd7−/− group. ** p = 0.0075, unpaired Student’s two-tailed t-test.