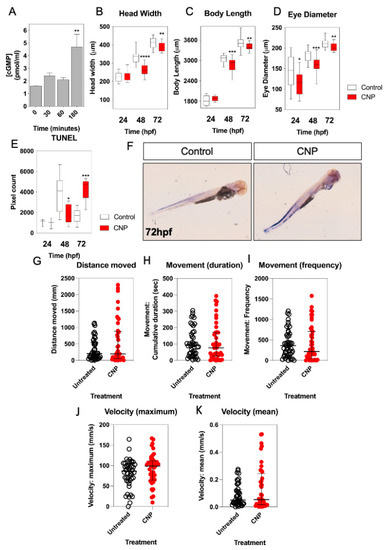
(A–K) Morphometric and locomotion analyses of TL/Wt zebrafish embryos exposed to exogenous CNP. (A) Total cGMP accumulation was measured in primary cultures of dispersed zebrafish embryos. Briefly, 250,000 cells/well were plated in 24-well plates and left to adhere for 24 h. Dispersed primary cell cultures were stimulated with physiological saline solution (PSS) containing 0 or 100 nM CNP in the presence of 1 mM isobutylmethylxanthine (IBMX) for up to 180 min. Stimulations were terminated with 100% (v/v) ice-cold EtOH, and samples extracted before assaying for total cGMP. Data shown are the means ± SEM of 3 independent stimulations (** p < 0.01, significantly different to control (0 nM CNP)). (B–D) TL/Wt zebrafish embryos, which had been reared in either 0 (control) or 100 nM CNP, were captured between 24 hpf, 48 hpf and 72 hpf, dechorionated and fixed with 4% (w/v) PFA. Embryos were subsequently mounted and 20× magnification phase-contrast images captured using an Axiovert 135 inverted microscope (Carl Zeiss Ltd., Cambridge, UK) and DC500 color camera. Phase-contrast images were Z-stacked using Adobe Photoshop (Adobe, San Jose, CA, USA) and morphometric measurements collected using ImageJ (http://imagej.nih.gov/in/, accessed on 1 January 2015). Measurements were taken for: embryo length (n = 12), head width (n = 12) and eye diameter (n = 12). Data shown are box-and-whisker plots of medians (with min-max values), analyzed by a paired t-test (2-tailed); * p < 0.05, ** p < 0.01, *** p < 0.001, **** p < 0.0001, significantly different from control. (E) TUNEL assays were performed on control and CNP-treated zebrafish embryos at 24 hpf (n = 3), 48 hpf (n = 8) and 72 hpf (n = 5); * p < 0.05, *** p < 0.001, significantly different from control. (F) Representative live images for untreated and CNP-treated embryos were captured using and a Nikon 159 dsZ2mv color camera, objective magnification was 10× and variable stage magnification at 3×. (G–K) Locomotion assays were performed over 24 h, with 72 hpf TL/Wt zebrafish larvae, which had been reared in either normal aquaria water or exposed to 100 nM CNP, to determine distance moved, movement duration, movement frequency, mean and maximum velocity. Data shown are dot plots, with medians and interquartile ranges calculated from control or CNP-treated larvae (n = 48).
|
