FIGURE SUMMARY
Title

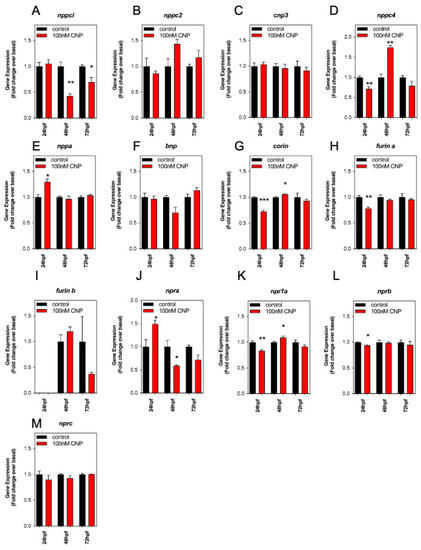
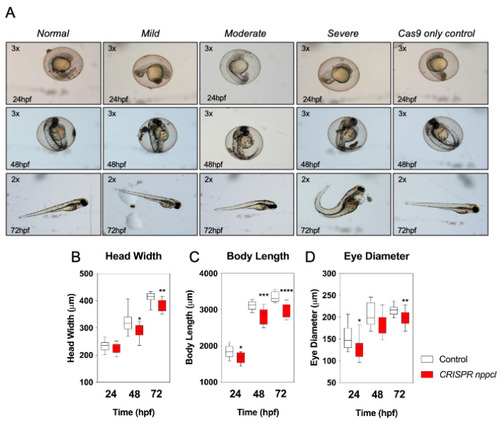
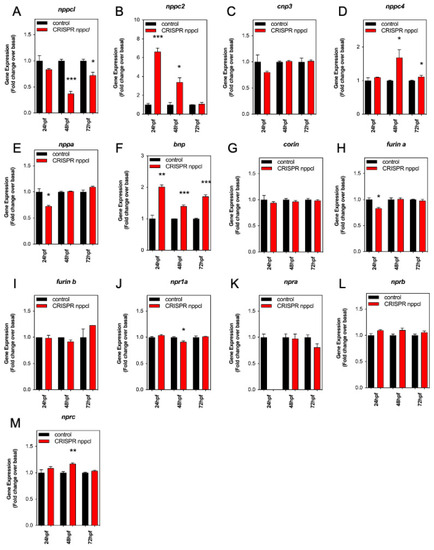
Pharmacological and Genetic Disruption of C-Type Natriuretic Peptide (nppcl) Expression in Zebrafish (Danio rerio) Causes Stunted Growth during Development

Authors
Lessey, A.J., Mirczuk, S.M., Chand, A.N., Kurrasch, D.M., Korbonits, M., Niessen, S.J.M., McArdle, C.A., McGonnell, I.M., Fowkes, R.C.
Source
Full text @ Int. J. Mol. Sci.

(AC) Structural and molecular analyses of zebrafish C-type natriuretic peptides. (A) Multiple sequence alignments of published whole-natriuretic-peptide precursor sequences were aligned using Clustal Omega (http://www.ebi.ac.uk/Tools/msa/clustalo). Evolutionary genetic analysis was performed on the resulting alignment using MEGA5 (http://megasoftware.net) and a phylogenetic tree created using the maximum-likelihood method and Tamura–Nei substitution model. Nonparametric bootstrap sampling was performed (1000 replicates) alongside and shown as a percentage at each corresponding node. Scale bar represents a genetic distance of 0.2. (B) Zebrafish C-type natriuretic peptide, CNP1 (nppc-like), CNP2 (nppc2-like), CNP 3, (cnp3-like) and CNP 4 (nppc4-like), amino acid sequences were obtained from NCBI Protein (http://www.ncbi.nlm.nih.gov/protein) and processing endopeptidase cleavage sites identified. Predicted mature zebrafish CNPs were aligned with human and murine CNP using Clustal Omega (http://www.ebi.ac.uk/Tools/msa/clustalo) to assess structural similarities. Resulting sequence alignment with regions of high or absolute conservation highlighted in grey. Structural representation of known and predicted mature peptides. Amino acids that differ from human CNP are highlighted in red and calculated sequence homology with human CNP displayed as a percentage next to each zebrafish peptide. (C) Tupfel-long fin (TL) wild-type zebrafish embryos were captured at 6, 12, 24, 36, 48, 72, 96 and 120 h post-fertilization (hpf) along with adult zebrafish head (AH) and torso (AT) segments and harvested for total RNA extraction. cDNA was subsequently generated at 100 ng/µL for each developmental time point and used in PCR reactions with oligonucleotide primers designed against zebrafish nppc-like (CNP1) (product size: 602 bp), nppc2-like (CNP2) (332 bp), cnp3-like (CNP3) (557 bp), nppc4-like (CNP4) (379 bp) npra (GC-A) (352 bp), npr1a (GC-A) (640 bp), nprb (GC-B) (429 bp), nprc (NPR3) (748 bp), nppa (ANP) (602 bp), nppb (BNP) (332 bp) and β-actin (410 bp) alongside a no template control (ø). PCR products were electrophoresed on a 1.6% (w/v) agarose gel and visualized using ethidium bromide on a Bio-Rad ChemiDoc MP system (Bio-Rad, Hercules, CA, USA).

(AF) Wholemount in situ hybridization of nppcl in 96 hpf wild-type zebrafish embryos. Zebrafish embryos were captured at 96 hpf and fixed with 4% PFA before wholemount in situ hybridization was performed to assess spatial expression of nppcl alongside sense probe controls. Images were captured at 20× (A,B) and 5x magnification (CF) using bright-field microscopy on an Axiovert 135 inverted microscope (Carl Zeiss Ltd., Cambridge, UK) and DC500 color camera. In situ hybridization was performed using 12–15 embryos for each RNA probe and images are representative of the staining observed in multiple embryos. (PPH—presumptive pituitary and hypothalamus; F—forebrain; M—midbrain; H—hindbrain).

(AF) Expression levels of natriuretic peptide system genes in developing wild-type zebrafish embryos. (A) Total RNA was extracted from whole TL/Wt zebrafish embryos captured at 72 hpf and normalized to 100 ng/µL. Target-specific cDNA synthesis performed followed by multiplex RT-qPCR examining the simultaneous expression of components of the zebrafish natriuretic peptide system (nppc4, nppcl, nppc2, cnp3, nppa, bnp, npra, npr1a, nprb, nprc, corin, furina and furinb). Products were separated using capillary gel electrophoresis and expression quantified using the GenomeLab GeXP analysis system. (BF) Temporal expression of zebrafish natriuretic peptide pathway genes during development. Total RNA was extracted from whole TL/Wt zebrafish embryos captured at 24, 48, 72, 96 or 120 hpf and normalized to 100 ng/µL. Target-specific cDNA synthesis performed followed by multiplex RT-qPCR examining the simultaneous expression of components of the zebrafish natriuretic peptide system (B: nppa, bnp; C: nppc2, cnp3, nppc4; D: nppcl; E: npr1a, nprb, nprc; F: corin, furina, furinb). Products were separated using capillary gel electrophoresis and expression quantified using the GenomeLab GeXP analysis system. Data shown are normalized to the housekeeping gene (elfα) and presented as the mean ± SEM from 6 to 8 independent RNA extractions (except for furin b, where n = 4); * p < 0.05, ** p < 0.01, *** p < 0.001, **** p < 0.0001, significantly different from 24 hpf.

(AK) Morphometric and locomotion analyses of TL/Wt zebrafish embryos exposed to exogenous CNP. (A) Total cGMP accumulation was measured in primary cultures of dispersed zebrafish embryos. Briefly, 250,000 cells/well were plated in 24-well plates and left to adhere for 24 h. Dispersed primary cell cultures were stimulated with physiological saline solution (PSS) containing 0 or 100 nM CNP in the presence of 1 mM isobutylmethylxanthine (IBMX) for up to 180 min. Stimulations were terminated with 100% (v/v) ice-cold EtOH, and samples extracted before assaying for total cGMP. Data shown are the means ± SEM of 3 independent stimulations (** p < 0.01, significantly different to control (0 nM CNP)). (BD) TL/Wt zebrafish embryos, which had been reared in either 0 (control) or 100 nM CNP, were captured between 24 hpf, 48 hpf and 72 hpf, dechorionated and fixed with 4% (w/v) PFA. Embryos were subsequently mounted and 20× magnification phase-contrast images captured using an Axiovert 135 inverted microscope (Carl Zeiss Ltd., Cambridge, UK) and DC500 color camera. Phase-contrast images were Z-stacked using Adobe Photoshop (Adobe, San Jose, CA, USA) and morphometric measurements collected using ImageJ (http://imagej.nih.gov/in/, accessed on 1 January 2015). Measurements were taken for: embryo length (n = 12), head width (n = 12) and eye diameter (n = 12). Data shown are box-and-whisker plots of medians (with min-max values), analyzed by a paired t-test (2-tailed); * p < 0.05, ** p < 0.01, *** p < 0.001, **** p < 0.0001, significantly different from control. (E) TUNEL assays were performed on control and CNP-treated zebrafish embryos at 24 hpf (n = 3), 48 hpf (n = 8) and 72 hpf (n = 5); * p < 0.05, *** p < 0.001, significantly different from control. (F) Representative live images for untreated and CNP-treated embryos were captured using and a Nikon 159 dsZ2mv color camera, objective magnification was 10× and variable stage magnification at 3×. (GK) Locomotion assays were performed over 24 h, with 72 hpf TL/Wt zebrafish larvae, which had been reared in either normal aquaria water or exposed to 100 nM CNP, to determine distance moved, movement duration, movement frequency, mean and maximum velocity. Data shown are dot plots, with medians and interquartile ranges calculated from control or CNP-treated larvae (n = 48).

(AM) RT-qPCR analysis of C-type natriuretic peptide system genes during development in Wt zebrafish embryos treated with exogenous CNP. Total RNA was extracted from whole TL/Wt zebrafish embryos, which had been reared in either normal aquaria water or exposed to 100 nM CNP, captured at 24, 48, or 72 hpf (n = 3 for each time point) and normalized to 100 ng/µL. (AM) Target-specific cDNA synthesis was performed followed by multiplex RT-qPCR examining the simultaneous expression of components of the zebrafish natriuretic peptide system (nppc4, nppcl, nppc2, cnp3, nppa, bnp, npra, npr1a, nprb, nprc, corin, furina and furinb). Products were separated using capillary gel electrophoresis and expression quantified using the GenomeLab GeXP analysis system. Data were normalized to the housekeeping gene (elfα) and the mean displayed as fold change over basal expression found in untreated embryos, * p < 0.05, ** p < 0.01, *** p < 0.001, significantly different from control-treated embryos (n = 3 independent experiments).

(AD) Morphometric analysis of TL/Wt zebrafish embryos injected with nppcl/gRNA/Cas9 RNA. Zebrafish mutants co-injected with nppcl-gRNA and Cas9 RNA were reared alongside embryos injected with Cas9 RNA only and collected at 24 hpf, 48 hpf and 72 hpf, dechorionated and fixed with 4% (w/v) PFA. Embryos were subsequently mounted and 20x magnification phase-contrast images captured using an Axiovert 135 inverted microscope (Carl Zeiss Ltd., Cambridge, UK) and DC500 color camera. Phase-contrast images were Z-stacked using Adobe Photoshop (Adobe, USA) and morphometric measurements collected using ImageJ (http://imagej.nih.gov/in/). (AC) Measurements were taken for: embryo length (n = 12), head width (n = 12) and eye diameter (n = 12). (D) Representative live images for were captured using a Nikon SMZ1500 stereomicroscope and a Nikon ds-2mv color camera, objective magnification was 10× and variable stage magnification at 3×. Data shown are box-and-whisker plots of medians (with min-max values), analyzed by a paired t-test (2-tailed); * p < 0.05, ** p < 0.01, *** p < 0.001, **** p < 0.0001, significantly different from control.

(AM) RT-qPCR analysis of C-type natriuretic peptide system genes during development in Wt zebrafish embryos embryos injected with nppcl/gRNA/Cas9 RNA. Total RNA was extracted from whole TL/Wt zebrafish embryos, which had been reared in either normal aquaria water or exposed to 100 nM CNP, captured at 24, 48, or 72 hpf (n = 3 for each time point) and normalized to 100 ng/µL. (AZD) Target-specific cDNA synthesis was performed followed by multiplex RT-qPCR examining the simultaneous expression of components of the zebrafish natriuretic peptide system (nppc4, nppcl, nppc2, cnp3, nppa, bnp, npra, npr1a, nprb, nprc, corin, furina and furinb). Products were separated using capillary gel electrophoresis and expression quantified using the GenomeLab GeXP analysis system. Data were normalized to the housekeeping gene (elfα) and the mean displayed as fold change over basal expression found in untreated embryos. * p < 0.05, ** p < 0.01, *** p < 0.001 significantly different from control-treated embryos (n = 3 independent experiments).

Acknowledgments
This image is the copyrighted work of the attributed author or publisher, and ZFIN has permission only to display this image to its users. Additional permissions should be obtained from the applicable author or publisher of the image. Full text @ Int. J. Mol. Sci.