|
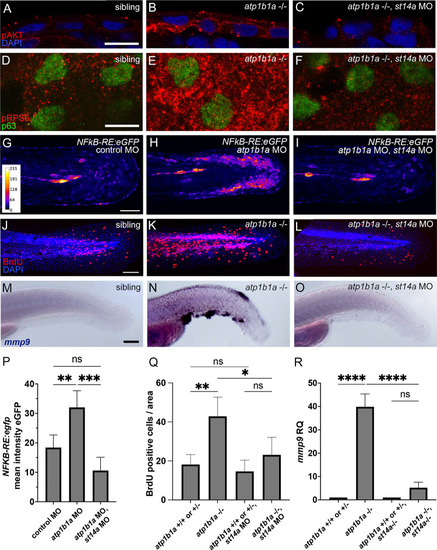
Matriptase-1 functions upstream of PI3K-AKT-mTORC1-NFkB to induce hyperproliferation and partial EMT. (A-C) Immunofluorescence on cross-sections of 54 hpf atp1b1a sibling (A), atp1b1a mutant (B), and atp1b1a mutant injected with st14a MO (C) showing pAKT (red) in basal cells in atp1b1a-/- but not in atp1b1a-/-, st14a MO (N = 3, n = 41–46). (D-F) Immunofluorescence on whole mounts, lateral views on trunk region for pRPS6 (red) and tp63 (green) in 54 hpf atp1b1a sibling (D), atp1b1a mutant (E), and atp1b1a mutant injected with st14a MO (F) (N = 3, n = 27–32). (G-I) Confocal images of the tail region of live 54 hpf embryos transgenic for NFkB-RE:eGFP injected with control MO (G), injected with atp1b1a MO (H) or co-injected with atp1b1a and st14a MO (I). Intensity of the GFP signal is color-coded. (J-L) Immunofluorescence of BrdU incorporation (red) of 56 hpf wild-type sibling (J), atp1b1a mutant (K), and atp1b1a mutant injected with st14a MO (L). (M-O) Whole mount in situ hybridization of mmp9 in 58 hpf wild-type sibling (M), atp1b1a mutant (N), or atp1b1a mutant injected with st14a MO (O) (N = 2, n = 18–24). (P) Quantification of GFP signal obtained from the fin fold region of embryos as shown in (G-I) (n = 3–5). (Q) Quantification of BrdU-positive cells in the fin fold area (n = 3–5). (R) RT-qPCR showing relative quantities of mmp9 transcript of 58 hpf atp1b1a-/- mutants in comparison to their atp1b1a+/+ and atp1b1a+/- siblings, either containing (bars 1+2) or lacking (st14a-/-; bars 3+4) functional Matriptase-1 (cDNA obtained from 15 pooled embryos each, N = 3). Significances in (P-R) were determined via a one-way ANOVA and Tukey’s post hoc test; ns, not significantly different (p>0.05); *,**,***,**** significantly different with p<0.05, p<0.01, p<0.001, p<0.0001, respectively. Scale bars: 10 μm (A,D,G,J,M).
|