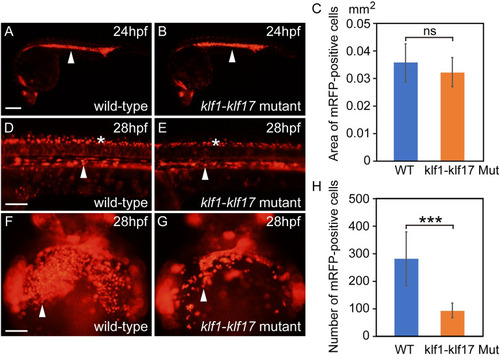
Blood circulation in wild-type and klf1-klf17 mutant embryos. Fluorescence microscopy images of the wild-type (A, D, F) and klf1-klf17 mutant (B, E, G). Lateral views, with the anterior to the right (A, B, D, E). Ventral views, with the anterior at the top (F, G). (A, B) gata1:mRFP-positive erythroid cells (white arrowheads) in the ICM at 24 hpf. Genotyping of individual embryos was performed by genomic PCR. Scale bar, 200 μm (A). (C) Area existing gata1:mRFP-positive erythroid cells in the ICM at 24 hpf. The area of gata1:mRFP-positive erythroid cells in the ICM was comparable between wild-type (n = 3) and klf1-klf17 mutant (n = 7). The data shown are the mean ± standard deviation (SD). ns, not significant. (D, E) gata1:mRFP-positive erythroid cells (white arrowheads) in the dorsal aorta and gata1:mRFP-positive neurons (asterisks) in the neural tube at 28 hpf. Scale bar, 100 μm (D). (F, G) gata1:mRFP-positive erythroid cells (white arrowheads) on the yolk at 28 hpf. Scale bar, 100 μm (F). (H) Number of gata1:mRFP-positive erythroid cells on the yolk. The number of gata1:mRFP-positive erythroid cells was reduced in the klf1-klf17 mutant (n = 7) compared to that of wild-type (n = 9). The data shown are the mean ± standard deviation (SD). *** P < 0.001 was considered significant.
|
