
Fig. 8
- ID
- ZDB-FIG-230721-15
- Publication
- Dumitrescu et al., 2022 - Time-Dependent Monitoring of Dopamine in the Brain of Live Embryonic Zebrafish Using Electrochemically Pretreated Carbon Fiber Microelectrodes
- Other Figures
- All Figure Page
- Back to All Figure Page
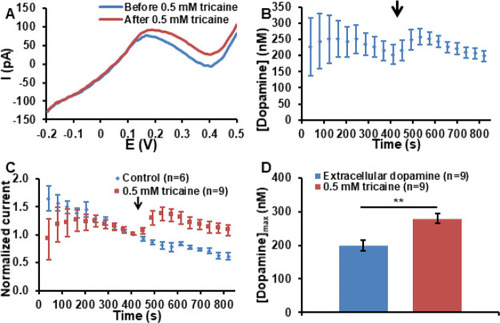
(A) Typical DPVs recorded at the implantation site in a 5 dpf zebrafish embryo exhibits an oxidation peak at 0.2 V associated with the oxidation of dopamine. After the addition of tricaine in the near proximity of the embryo, the dopamine oxidation peak is increasing. (B) Average dopamine concentration–time trace measured in the tectum of 5 dpf zebrafish embryos. The arrow indicates the injection of tricaine in the near proximity of the embryos at 410 s. The error bars represent the standard error of the mean for n = 9 replicate experiments in individual embryos. (C) Comparison of normalized oxidation current–time traces for the control and tricaine addition experiments. The oxidation currents were normalized to the value measured just before the addition of the control or tricaine sample, as indicated by the arrow. The error bars represent the standard error of the mean for “n” replicate experiments in individual embryos. (D) Comparison between the average dopamine concentrations measured before and after the addition of tricaine. The extracellular dopamine concentration represents the average concentration measured just before the injection of nomifensine in the medium. The dopamine concentration associated with the exposure to 0.5 mM tricaine is the average of the maximum dopamine concentrations after the injection of tricaine for each single measurement. The error bars represent the standard error of the mean for n = 9 replicate experiments in individual embryos. Statistical significance is calculated using the paired t-test and it is indicated by one (*) and two (**) asterisks at p < 0.05 and p < 0.01, respectively. |