
Fig. 3
- ID
- ZDB-FIG-230719-22
- Publication
- Wang et al., 2022 - Tal2 is required for generation of GABAergic neurons in the zebrafish midbrain
- Other Figures
- All Figure Page
- Back to All Figure Page
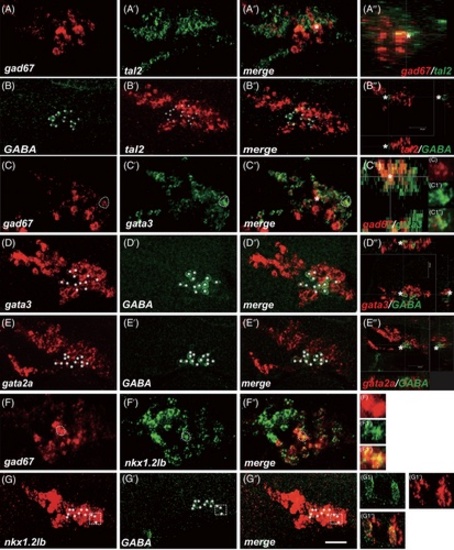
GABAergic neurons co-express tal2, gata3, gata2a, and nkx1.2lb factors in the diencephalon and nMLF. (A-A‴) Heads of wild-type of 30 hpf zebrafish hybridized to gad67 (A) and tal2 (A′) antisense probes, a merged view (A″), and a transverse section at the level of cell marked with asterisk (A‴). gad67 expressing cells are tal2-positive in the diencephalon and nMLF with a varying level. (B-B‴) GABA immunohistochemistry (B), tal2 in situ hybridization (B′), a merged view (B″), and a transverse section at the level of cell marked with asterisk (B‴). Almost all GABAergic neurons co-express tal2 mRNA in the nMLF (plus). (C-C‴) gad67 (C), gata3 (C′) expressing cells, merge (C″), and a transverse section at the level of cell marked with asterisk (C‴). gad67 mRNA expressing cells co-express gata3 at the single cell level (C1 to C1″). (D-D‴) gata3 in situ hybridization (D), GABA immunohistochemistry (D′), a merged view (D″), and a transverse section at the level of cell marked with asterisk (D‴). All GABAergic neurons co-express gata3 mRNA in the nMLF (asterisk). (E-E‴) gata2a in situ hybridization (E), GABA immunohistochemistry (E′), a merged view (E″), and a transverse section at the level of cell marked with asterisk (E‴). Many GABAergic neurons co-express gata2a mRNA in the nMLF (stars). (F-F″) gad67 (F), nkx1.2lb (F′) expressing cells, merge (F″), and views at the level of single cell (F1 to F1″). gad67 mRNA expressing cells co-express nkx1.2lb. (G-G″) nkx1.2lb (G), GABA immunohistochemistry (G′), a merged view (G″), and views at the level of single cell (G1 to G1″). All GABAergic neurons co-express nkx1.2lb mRNA (asterisk). (A-F″) projections of single section. Dashed regions in main panels (C-C′) and (F-G″) are shown in magnified view in panels (C1-G1″). All embryos' eyes were removed by dissection. Dorsal is up; rostral, to the left. Scale bar: 25 μm |