
Figure 4.
- ID
- ZDB-FIG-230719-13
- Publication
- Dryer et al., 2023 - Comparison of tumor growth assessment using GFP fluorescence and DiI labeling in a zebrafish xenograft model
- Other Figures
- All Figure Page
- Back to All Figure Page
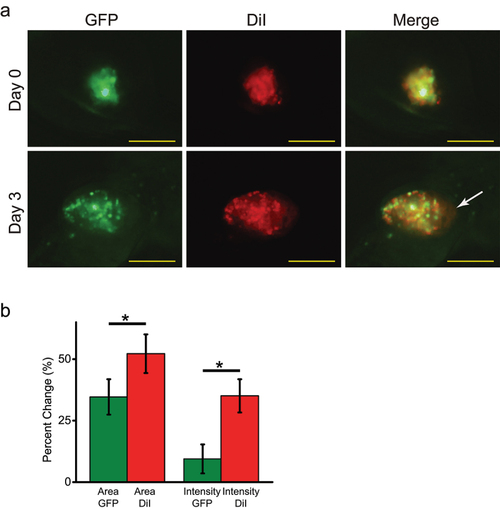
Comparison of GFP fluorescence and DiI labeling of zebrafish xenografts of GFP-expressing and DiI labeled MDA-MB-231 cells. (a) Representative DiI, GFP and merged fluorescence images of a zebrafish xenograft tumor on Day 0 and Day 3 post-injection into 2pdf zebrafish embryos, as indicated. The white arrow indicates the DiI labeled border area of the tumor that lacks GFP-fluorescence. Scale bar = 50 μm. (b) Percent change in the tumor area and intensity determined based on the GFP fluorescence or DiI labeling. Average percent change in tumor area was 34.62 ± 7.2 based on the GFP fluorescence and 52.22 ± 7.86 based on the DiI labeling ( |