
Figure 2.
- ID
- ZDB-FIG-230719-9
- Publication
- Dryer et al., 2023 - Comparison of tumor growth assessment using GFP fluorescence and DiI labeling in a zebrafish xenograft model
- Other Figures
- All Figure Page
- Back to All Figure Page
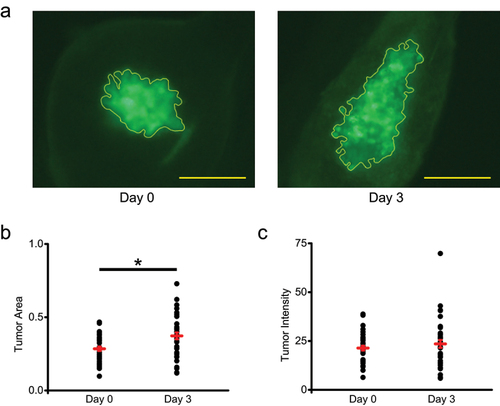
GFP fluorescence of zebrafish xenografts of GFP-expressing and DiI labeled MDA-MB-231 cells. (a) Representative image of a zebrafish xenograft tumor area outlined in yellow based on the GFP fluorescence on Day 0 and Day 3 post-injection into 2pdf zebrafish embryos. Scale bar = 50 μm. (b) Quantification of tumor area based on the GFP fluorescence on Day 0 and Day 3. Average tumor area was 0.28 ± 0.01 on Day 0 and 0.37 ± 0.02 on Day 3 ( |