
Figure 7
- ID
- ZDB-FIG-230703-13
- Publication
- Henderson et al., 2023 - Proteinase 3 promotes formation of multinucleated giant cells and granuloma-like structures in patients with granulomatosis with polyangiitis
- Other Figures
- All Figure Page
- Back to All Figure Page
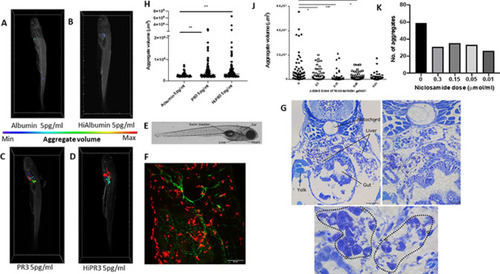
Enzymatically active and inactive PR3 stimulates macrophage aggregation and MGC formation in zebrafish and is inhibited by niclosamide. MPEg-cherry zebrafish (n=10 per group) were injected with human PR3 or albumin (intact or following heat inactivation) and imaged by lightsheet microscopy. Aggregate volumes were calculated by three-dimensional rendering of images following application of automated thresholds. Colour scale was used to demonstrate minimal and maximal aggregate volumes. Albumin with or without heat inactivation (A, B) showed minimal macrophage aggregation compared with enzymatically active and inactive PR3 at 5 pg/mL (C, D). Scale bar 100 µm. (F) Maximum projection of a 5-day-old transgenic larva (tg(flt4:mCitrine, mpeg::mCherry)) injected with PR3 into the yolk sac at 24 hours post fertilisation, at the level shown in E. The developing lymphatic system is labelled in green and peripheral macrophages are labelled in red. (E) Brightfield micrograph of a 5-day-old transgenic zebrafish larva injected with PR3 at 1 day post fertilisation, with certain anatomical structures labelled. Dashed line represents the approximate location of sections shown in G. (G) Plastic sections through the same zebrafish larva at multiple levels. MGCs can be seen (highlighted by white stars) and loose granulomas are outlined (dotted lines). Scale bars are 100 µm, 20 µm and 10 µm, respectively. Counting the number and calculating the size of the macrophage aggregates showed a significant increase in both the number and volume of macrophage aggregates in MPEg-cherry zebrafish injected with enzymatically active or inactive PR3 compared with albumin (H). Niclosamide was administered to zebrafish water following injection with PR3. Compared with PR3 alone (J, K), there was a reduction in aggregate volume and number in zebrafish injected with 0.3 µmol/mL, 0.15 µmol/mL and 0.05 µmol/mL niclosamide. Values plotted as median and 95% CI; *p<0.05, **p<0.01, ***p<0.001. Difference between conditions determined by two-way ANOVA. ANOVA, analysis of variance; Hi, heat-inactivated; MGC, multinucleated giant cells; MPeg, macrophage expressed; PR3, proteinase 3. |