FIGURE

Figure 3

ID
ZDB-FIG-230619-23
Publication
Fleischhauer et al., 2023 - Glucocorticoid effects in the regenerating fin reflect tissue homeostasis disturbances in zebrafish by affecting Wnt signaling
Other Figures
All Figure Page
Back to All Figure Page
Figure 3

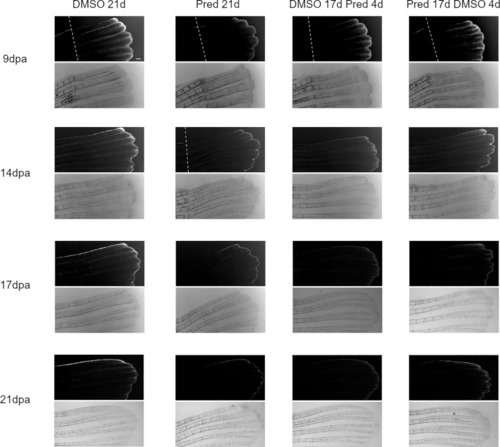
Images of the mCherry-fluorescent Wnt-active zone in zebrafish fin regenerates. The 7xTCF-Xia.Siam:nlsmCherry expression is detectable due to mCherry fluorescence (upper rows). Corresponding brightfield images are shown below. Within one treatment group, the same individual is shown across time points. From left to right: fish underwent 21 days of DMSO, 21 days of prednisolone, 17 days of DMSO followed by 4 days of prednisolone and 17 days of prednisolone followed by 4 days of DMSO treatment. Scalebar 200 µm. The white dotted lines indicate amputation planes in the fluorescence view of the fins. n (DMSO 21d,9/14/17/21dpa) = 5 (4 females, 1 male); n (Pred 21d,9dpa) = 8 (6 females, 2 males), n (Pred 21d,14dpa) = 7 (6 females, 1 male), n (Pred 21d,17/21dpa) = 6 (6 females); n (DMSO 17d Pred 4d,9/14dpa) = 8 (6 females, 2 males), n (DMSO 17d Pred 4d,17/21dpa) = 7 (6 females, 1 male); n (Pred 17d DMSO 4d,9dpa) = 8 (6 females, 2 males), n (Pred 17d DMSO 4d,14/17/21dpa) = 7 (6 females, 1 male).

Expression Data

Expression Detail
Antibody Labeling
Phenotype Data

Phenotype Detail
Acknowledgments
This image is the copyrighted work of the attributed author or publisher, and ZFIN has permission only to display this image to its users. Additional permissions should be obtained from the applicable author or publisher of the image. Full text @ Front Endocrinol (Lausanne)