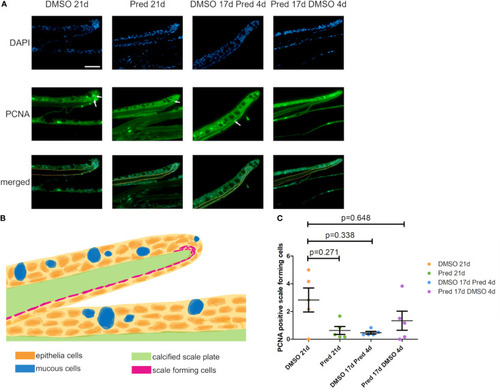
Proliferation of scale forming cells after treatment. (A) Immunohistochemical staining against PCNA and nuclear counterstain with DAPI. From left to right: fish underwent 21 days of DMSO, 21 days of prednisolone, 17 days of DMSO followed by 4 days of prednisolone and 17 days of prednisolone followed by 4 days of DMSO treatment. Scalebar 50 µm. White arrows indicate some PCNA+ cells. Yellow dotted lines outline the calcified scale plate together with the scale forming cells. (B) Schematic section view of a zebrafish scale in the zebrafish trunk. The calcified scale plate (green) is enclosed by the skin epithelium containing layers of epithelial (orange) and mucous cells (blue). The scale-forming cells (magenta) are in close proximity to the calcified scale plate. They cover the lower side of the scale and are located in higher number at the scale tip (in the marginal zone). (C) Quantification of PCNA+ scale forming cells in the different groups (21 days of DMSO, 21 days of prednisolone, 17 days of DMSO followed by 4 days of prednisolone and 17 days of prednisolone followed by 4 days of DMSO treatment). Data are mean ± SD of PCNA+ scale forming cells. Each dot represents one biological replicate. Non-parametric testing because of non-normal distribution of the data. Statistical significance was tested by post-hoc Dunn’s multiple comparison after Kruskal-Wallis test. n=5 (4 females, 1 male in DMSO 21d, DMSO 17d Pred 4d, Pred 17 d DMSO 4d; 5 females in Pred 21d) in all groups with 1 section per individual.
|
