
Fig. 4
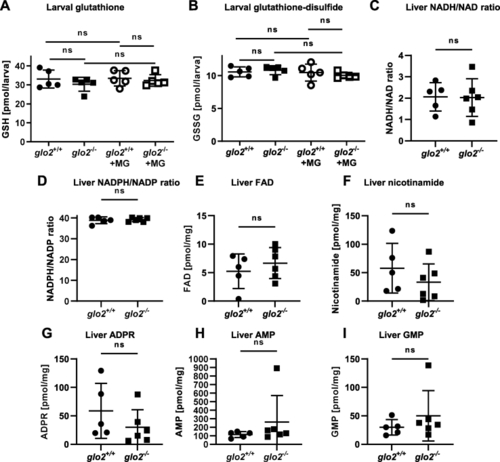
The redox status of larvae and the adult liver was unaffected by the loss of Glo2. A) The levels of glutathione remained unchanged in glo2−/− zebrafish under normal conditions as well as after incubation in 500 μM MG. Measurements were conducted using LC-MS/MS. One datapoint represents one clutch of 46 larvae, collected at 120 hpf. B) The levels of glutathione-disulfide remained unchanged in glo2−/− zebrafish under normal conditions as well as after incubation in 500 μM of MG. Measurements were conducted using LC-MS/MS. One datapoint represents one clutch of 46 larvae, collected at 120 hpf. C) NADH/NAD ratios and NADPH/NADP (D) ratios were normal in glo2−/− animal livers, indicating no increased redox stress. Liver FAD (E), nicotinamide (F), ADPR (G), AMP (H) and GMP (I) were unchanged in glo2−/− animals compared to glo2+/+ animals. Measured via GC-MS. One datapoint represents the liver of one adult zebrafish. N = 5. For statistical analysis normality tests were used for all samples, followed by unpaired t-test (A, B, C, D, E, F, G), or Mann-Whitney test (A, H, I). Data presented as mean ± SD. ns = p > 0.05. FAD: Flavin adenine dinucleotide, GSH: Glutathione, GSSG: Glutathione-disulfide, ADPR: adenosine diphosphate ribose, AMP: adenosine monophosphate, GMP: guanosine monophosphate, LC-MS: liquid chromatography/mass spectrometry, GC-MS: gas chromatography/mass spectrometry. |