
Fig. 2
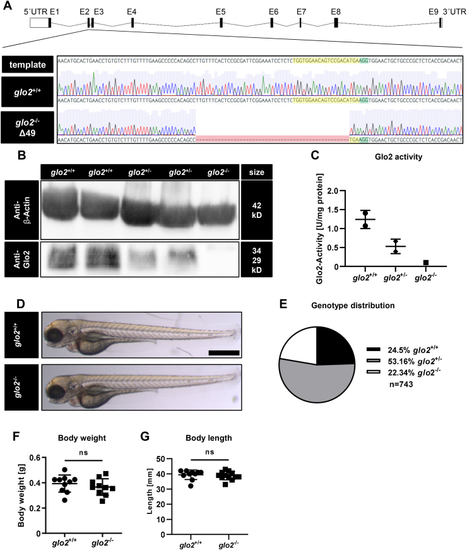
Generation and validation of glo2−/−zebrafish using CRISPR-Cas9. A) The target site (highlighted in yellow) and PAM site (highlighted in green) for CRISPR-Cas9 were selected in exon 2 of the glo2 gene. The gene-segment containing the target site was amplified with PCR and analyzed with Sanger sequencing. Subsequent genotyping was conducted using PCR, followed by electrophoresis of the PCR product in an agarose gel. Zebrafish with a 49 base pair deletion were selected for the generation of the glo2−/− line. B) The Western blot analysis using a Glo2-specific antibody showed a complete loss of Glo2 in adult glo2−/− zebrafish and a partial loss of Glo2 in glo2+/− zebrafish. Samples were derived from homogenized adult zebrafish tissue, β-Actin was used as loading control. Original images have been cropped. C) Glo2 activity measurements showed a 92 % loss of activity from glo2+/+ to glo2−/− samples and a 47 % loss from glo2+/+ to glo2+/− zebrafish. Tissue was derived from homogenized adult zebrafish. SD-Lactoylglutathione was used as substrate, activity was measured spectrophotometrically. One datapoint represents tissue from one zebrafish. N = 2/2/1. D) The gross morphology of glo2−/− larvae appeared unchanged at 96 hpf upon analysis with a light microscope. Scale bar = 500 μm. E) The distribution of genotypes in heterozygous matings showed the expected distribution and no significant loss of glo2−/− zebrafish, indicating normal survival. F) Adult glo2−/− zebrafish showed a normal body weight compared to glo2+/+ zebrafish. One datapoint represents one zebrafish. N = 10. G) Adult glo2−/− zebrafish showed a normal body length compared to glo2+/+ zebrafish. One datapoint represents one zebrafish. N = 10. For statistical analysis chi-square test, (E) and normality tests (F, G) were used, followed by unpaired t-test (F), or Mann-Whitney test (G). Data presented as mean ± SD. ns = p > 0.05, UTR: untranslated region, E: exon, WT: wildtype, kD: kilodalton. (For interpretation of the references to colour in this figure legend, the reader is referred to the Web version of this article.) |