|
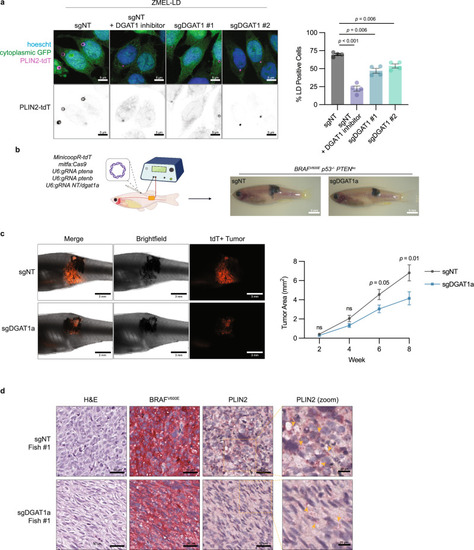
Knockout of DGAT1 suppresses lipid droplet formation and tumor progression. a Representative fluorescent images of ZMEL-LD lipid droplets marked by PLIN2-tdTOMATO. Cells were incubated with 100 µM oleic acid for 24 h and lipid droplets were quantified via flow cytometry (mean ± SEM, n = 4 biologically independent experiments). Statistics via two-tailed t-test with Holm-Sidak correction. b Schematic of zebrafish TEAZ. Transgenic casper;mitfa:BRAFV600E;p53−/− zebrafish were injected with tumor-initiating plasmids and electroporated to generate BRAFV600E p53−/− PTENko melanomas with normal or suppressed lipid droplet formation. c Representative images of zebrafish flank with TEAZ-generated tumors. Corresponding quantification of tumor area via image analysis as described in Methods (mean ± SEM, n = 3 biologically independent injections, sgNT n = 45, sgDGAT1a n = 49). Statistics via two-sided Mann-Whitney U test at each time point. d Representative histological images from week 12 TEAZ generated tumors with H&E, BRAFV600E, and PLIN2 staining (n = 4 fish per genotype). Yellow arrows denote punctate PLIN2 staining for lipid droplets. Figure 5b was created with Biorender.com.
|