
Fig. 4
- ID
- ZDB-FIG-230529-169
- Publication
- Forn-Cuní et al., 2022 - Stimulating the autophagic-lysosomal axis enhances host defense against fungal infection in a zebrafish model of invasive Aspergillosis
- Other Figures
- All Figure Page
- Back to All Figure Page
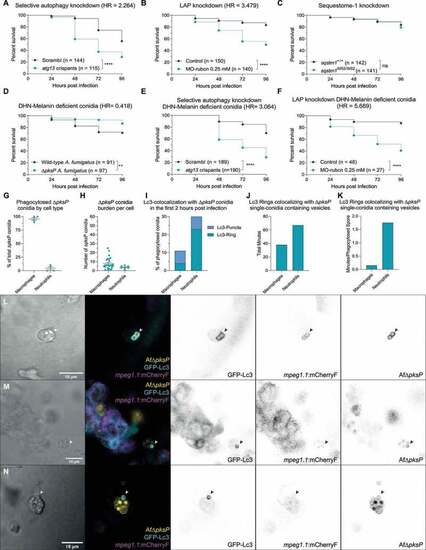
Suppression of autophagy pathways increases susceptibility to A. fumigatus infection. (a and b) Survival curves of atg13 mutation (a) or rubcn (b) knockdown or control zebrafish embryos infected with A. fumigatus ∆Ku80. (c) Survival curve of sqstm1 mutants or non-mutant siblings infected with A. fumigatus ∆Ku80. (d) Survival curve of zebrafish embryos infected with equal inoculum (150 conidia) of A. fumigatus ∆Ku80 or DHN-Melanin-deficient A. fumigatus ∆pksP. (e and f) Survival curves of atg13 mutation (e) or rubcn (f) knockdown or control zebrafish embryos infected with A. fumigatus ∆pksP. (G, H, I, J, and K) Quantification of phagocytosis and Lc3 dynamics in 21 hours of timelapse imaging from 5 individual larvae infected with A. fumigatus ∆pksP conidia labeled with Alexa Fluor™ NHS 647 during the first hours post infection. (g) Most of the injected conidia in the zebrafish hindbrain are phagocytosed by macrophages, and (h) macrophages phagocytose more conidia per cell than neutrophils. (i, j, and k) In the events of conidial phagocytosis by neutrophils, we observed rapid bright Lc3 rings covering single-conidia vesicles, while Lc3 decoration of conidia-containing vesicles in macrophages was scarcer and shorter in the first hours post infection. Examples of GFP-Lc3 signal around single A. fumigatus ∆pksP conidia labeled with Alexa Fluor™ NHS 647 (Af∆pksP) in mCherryF negative phagocytes (l, m), or mCherryF labeled macrophage (n). Images taken from Movie S4. All survival curves are representative of at least 3 independent biological replicates. The hazard ratio (HR) indicated is calculated vs. the control condition using the logrank method. Significance in the curve comparison is calculated using Log-rank (Mantel-Cox test): ns non-significant; * P ≤ 0.05; ** P ≤ 0.01; *** P ≤ 0.001; **** P ≤ 0.0001. |