
Fig. 1
- ID
- ZDB-FIG-230529-166
- Publication
- Forn-Cuní et al., 2022 - Stimulating the autophagic-lysosomal axis enhances host defense against fungal infection in a zebrafish model of invasive Aspergillosis
- Other Figures
- All Figure Page
- Back to All Figure Page
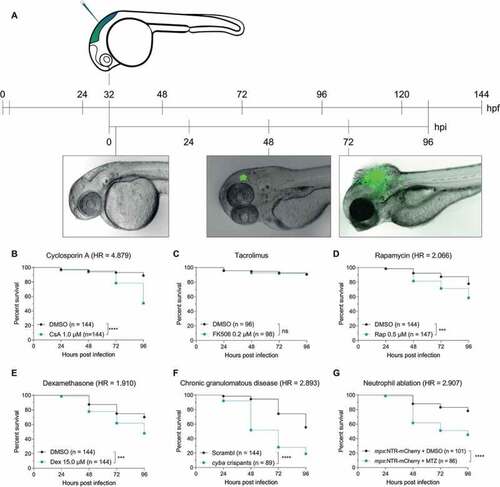
The zebrafish embryo model recapitulates susceptibilities of clinical IA. (a) Schematic representation of the zebrafish embryo – A. fumigatus infection model. Conidia of A. fumigatus D141 expressing an EGFP fluorescent plasmid were injected in the hindbrain at 32 hpf and representative images of infection at 2, 48 and 72 h post infection are shown. (B, C, D, and E) Survival curves of zebrafish embryos infected with A. fumigatus ∆Ku80 and exposed via waterborne treatment to 1 μM of cyclosporin A (b), 0.2 μM of FK506 (c), 0.5 μM of rapamycin (d), 15 μM of dexamethasone (e), or DMSO as a vehicle control at the same v/v. (f) Survival curves of cyba crispants or scramble control zebrafish embryos infected with A. fumigatus ∆Ku80. (g) Survival curves of zebrafish embryos with or without neutrophil ablation with metronidazole infected with A. fumigatus ∆Ku80. (b, d and f) are representative of at least 3 independent biological replicates, while (c) is representative of 2 independent biological replicates. The hazard ratio (HR) indicated is calculated vs. the control condition using the logrank method. Significance in the curve comparison is calculated using Log-rank (Mantel-Cox test): ns non-significant; * P ≤ 0.05; ** P ≤ 0.01; *** P ≤ 0.001; **** P ≤ 0.0001. |