
Figure 4
- ID
- ZDB-FIG-230518-69
- Publication
- Weichert-Leahey et al., 2023 - Genetic predisposition to neuroblastoma results from a regulatory polymorphism that promotes the adrenergic cell state
- Other Figures
- All Figure Page
- Back to All Figure Page
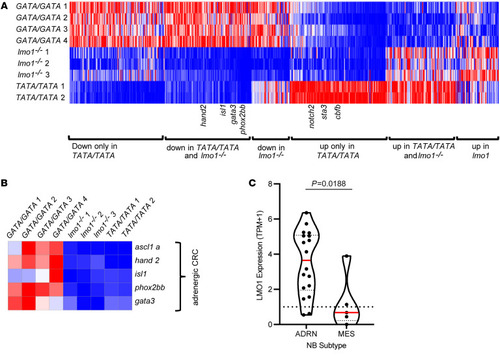
Lmo1 coregulates transcription factors that comprise the adrenergic neuroblastoma CRC.
(A) Heatmap image based on RNA-Seq data analysis showing differentially expressed genes in MYCN-induced neuroblastoma tumors arising in lmo1 GATA/GATA (WT), lmo1–/– and lmo1 TATA/TATA backgrounds categorized into 6 groups, as indicated. Each row corresponds to a gene, and signal intensity is normalized across the row. Genes were rank ordered from highest (right side of the map) to lowest (left side of the map) based on fold change of gene expression in TATA/TATA or lmo1–/– compared to GATA/GATA. (B) Heatmap representing gene expression changes of the known adrenergic neuroblastoma CRC transcription factors isl1, gata3, ascl1, phox2b, and hand2 in MYCN-induced neuroblastoma tumors arising in the GATA/GATA, lmo1–/– and TATA/TATA backgrounds. (C) LMO1 mRNA expression (TPM+1) violin plots retrieved from the 21Q1 release of Depmap (depmap.org) (18), from 23 neuroblastoma cell lines. Cell lines were defined as adrenergic (ADRN) (n = 18) or mesenchymal (MES) (n = 5) subtypes based on general gene expression profiles. Red bars indicate mean, dotted line indicates a TPM+1 of 1. P = 0.0188 by student’s t test. |