
Figure 2
- ID
- ZDB-FIG-230518-67
- Publication
- Weichert-Leahey et al., 2023 - Genetic predisposition to neuroblastoma results from a regulatory polymorphism that promotes the adrenergic cell state
- Other Figures
- All Figure Page
- Back to All Figure Page
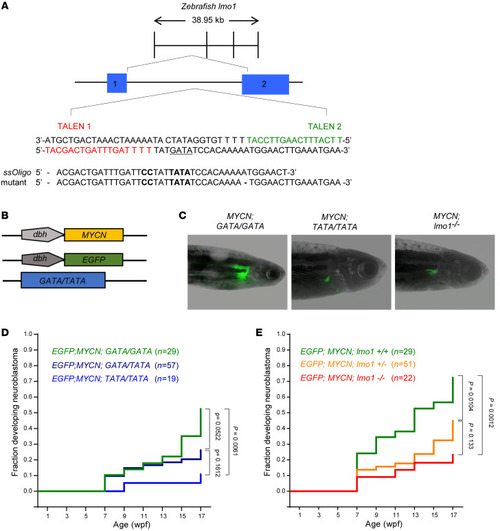
The development of MYCN-driven neuroblastomas is impaired in the TATA/TATA and lmo1-null backgrounds.
(A) Diagram illustrating the construction of the lmo1 GATA/TATA (GATA/TATA) zebrafish line in which TALEN-mediated gene editing was used to replace the G at rs2168101 with a T. The rs2168101 G resides within the first intron of the zebrafish lmo1 gene (exons 1 and 2 are denoted by blue boxes) and creates the first nucleotide of a GATA DNA-binding sequence (in bold). To facilitate the precise genome editing and knock-in of the T allele at this locus, we used TALEN gene-editing technology targeting the sequences flanking the G at rs2168101 (as indicated in red and green) together with a single-stranded DNA oligonucleotide containing a T instead of the G with short flanking homology arms of 20 nucleotides (TATA-ssOligo). To prevent TALEN binding to the 5′ arm and activity after successful knock-in of the TATA-ssOligo and to aid in the identification of embryos containing the modified sequence, the TATA-ssOligo was designed with 2 additional nucleotide changes (CC to replace TT in the 5′ homology arm, marked in bold) to create a new restriction site for TfiI (see also Supplemental Figure 3). (B) To analyze the effect of the rs2168101 G → T substitution on MYCN-induced neuroblastoma, compound transgenic zebrafish lines were created by crossing the transgenic lines Tg(dβh:MYCN) and Tg(dβh:EGFP) with the GATA/TATA knock-in line, as illustrated. The dβh:EGFP and dβh:MYCN lines, in which the zebrafish dβh promoter was used to facilitate tissue-specific expression of EGFP and MYCN, were established previously (24). (C) Representative fluorescent images of adult zebrafish showing EGFP-expressing tumors arising in the indicated transgenic lines. (D and E) Starting at 5 weeks postfertilization (wpf), zebrafish with the indicated genotypes were monitored biweekly for the presence of tumors by EGFP fluorescence microscopy. The graph shows a Kaplan-Meier analysis of the cumulative frequency of neuroblastomas in the transgenic lines. Statistical analysis was performed using the logrank test. |