
- Title
-
Genetic predisposition to neuroblastoma results from a regulatory polymorphism that promotes the adrenergic cell state
- Authors
- Weichert-Leahey, N., Shi, H., Tao, T., Oldridge, D.A., Durbin, A.D., Abraham, B.J., Zimmerman, M.W., Zhu, S., Wood, A.C., Reyon, D., Joung, J.K., Young, R.A., Diskin, S.J., Maris, J.M., Look, A.T.
- Source
- Full text @ Journal of Clin. Invest.
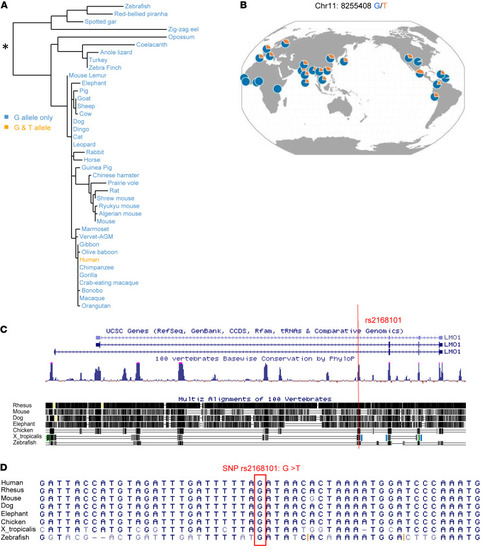
Evolutionary history of the G/T polymorphism at rs2168101.
(A) Phylogenetic tree representing the evolutionary relationship between the LMO1 genes from the indicated species over the last 400 million years. Blue font denotes species that exclusively harbor a G at rs2168101. Orange font denotes that only humans demonstrate a G/T polymorphism at the rs2168101 locus. (B) Distribution of the G and T alleles of rs2168101 across Human Genome Diversity Project (HGDP) populations, as illustrated by their genome browser (http://popgen.uchicago.edu/ggv/). Circles create a pie chart in which blue represents the proportion of human populations from different parts of the world with a G at rs2168101 (human chromosome 11, position 8255408), and orange represents the proportion with a T. (C) Shown is a modified UCSC Genome Browser (https://genome.ucsc.edu/) window of the human LMO1 locus indicating the 2 alternative transcription start sites and the position of rs2168101 in the first intron (top), a vertebrate conservation track graphing PhyloP conservation scores (middle), and Multiz alignments of multiple vertebrate species (bottom), illustrating a high level of conservation in the noncoding region surrounding rs2168101. (D) The immediate sequence neighborhood surrounding rs2168101 in the first intron of LMO1 from multiple species is shown. The G at rs2168101 in the human consensus sequence is marked with a red box. |
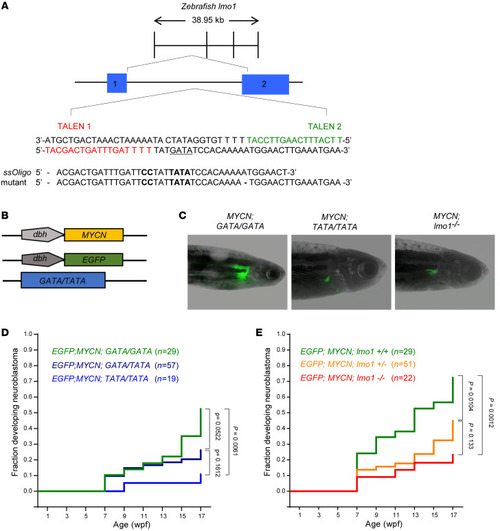
The development of MYCN-driven neuroblastomas is impaired in the TATA/TATA and lmo1-null backgrounds.
(A) Diagram illustrating the construction of the lmo1 GATA/TATA (GATA/TATA) zebrafish line in which TALEN-mediated gene editing was used to replace the G at rs2168101 with a T. The rs2168101 G resides within the first intron of the zebrafish lmo1 gene (exons 1 and 2 are denoted by blue boxes) and creates the first nucleotide of a GATA DNA-binding sequence (in bold). To facilitate the precise genome editing and knock-in of the T allele at this locus, we used TALEN gene-editing technology targeting the sequences flanking the G at rs2168101 (as indicated in red and green) together with a single-stranded DNA oligonucleotide containing a T instead of the G with short flanking homology arms of 20 nucleotides (TATA-ssOligo). To prevent TALEN binding to the 5′ arm and activity after successful knock-in of the TATA-ssOligo and to aid in the identification of embryos containing the modified sequence, the TATA-ssOligo was designed with 2 additional nucleotide changes (CC to replace TT in the 5′ homology arm, marked in bold) to create a new restriction site for TfiI (see also Supplemental Figure 3). (B) To analyze the effect of the rs2168101 G → T substitution on MYCN-induced neuroblastoma, compound transgenic zebrafish lines were created by crossing the transgenic lines Tg(dβh:MYCN) and Tg(dβh:EGFP) with the GATA/TATA knock-in line, as illustrated. The dβh:EGFP and dβh:MYCN lines, in which the zebrafish dβh promoter was used to facilitate tissue-specific expression of EGFP and MYCN, were established previously (24). (C) Representative fluorescent images of adult zebrafish showing EGFP-expressing tumors arising in the indicated transgenic lines. (D and E) Starting at 5 weeks postfertilization (wpf), zebrafish with the indicated genotypes were monitored biweekly for the presence of tumors by EGFP fluorescence microscopy. The graph shows a Kaplan-Meier analysis of the cumulative frequency of neuroblastomas in the transgenic lines. Statistical analysis was performed using the logrank test. |
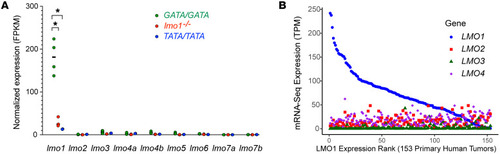
Expression of the lmo family genes in zebrafish and human neuroblastoma.
(A) RNA-Seq analysis was performed to measure the relative mRNA expression of lmo family genes in neuroblastomas arising in zebrafish with the indicated genotypes (GATA/GATA, n = 4; lmo1–/–, n = 3; and TATA/TATA, n = 2). mRNA expression levels for the indicated lmo family genes are represented by FPKM log-scale values. Expression under 1 FPKM is considered as nonexpressed. Statistical analysis was performed using the 2-tailed, unpaired t test. *P < 0.005. (B) Relative LMO1-4 mRNA expression levels measured by RNA-Seq in 153 primary human neuroblastoma samples (from TARGET), ranked from highest (left) to lowest levels of LMO1 expression (in FPKM). Expression correlation analysis demonstrated weak inverse correlation between LMO1 and the other 3 LMO family members (R ≥ –0.3, P < 0.05). |
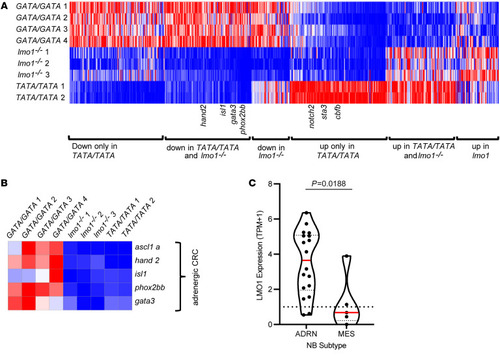
Lmo1 coregulates transcription factors that comprise the adrenergic neuroblastoma CRC.
(A) Heatmap image based on RNA-Seq data analysis showing differentially expressed genes in MYCN-induced neuroblastoma tumors arising in lmo1 GATA/GATA (WT), lmo1–/– and lmo1 TATA/TATA backgrounds categorized into 6 groups, as indicated. Each row corresponds to a gene, and signal intensity is normalized across the row. Genes were rank ordered from highest (right side of the map) to lowest (left side of the map) based on fold change of gene expression in TATA/TATA or lmo1–/– compared to GATA/GATA. (B) Heatmap representing gene expression changes of the known adrenergic neuroblastoma CRC transcription factors isl1, gata3, ascl1, phox2b, and hand2 in MYCN-induced neuroblastoma tumors arising in the GATA/GATA, lmo1–/– and TATA/TATA backgrounds. (C) LMO1 mRNA expression (TPM+1) violin plots retrieved from the 21Q1 release of Depmap (depmap.org) (18), from 23 neuroblastoma cell lines. Cell lines were defined as adrenergic (ADRN) (n = 18) or mesenchymal (MES) (n = 5) subtypes based on general gene expression profiles. Red bars indicate mean, dotted line indicates a TPM+1 of 1. P = 0.0188 by student’s t test. |
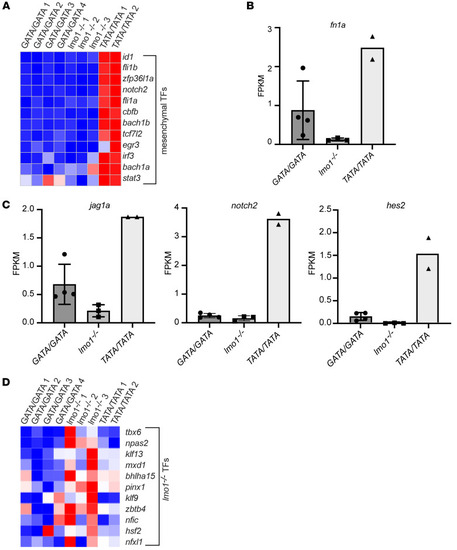
MYCN-driven neuroblastomas from the TATA/TATA line, but not the lmo1–/– line, express the mesenchymal CRC.
(A) Heatmap image based on RNA-Seq data analysis showing the indicated genes of the mesenchymal CRC, which are upregulated in the MYCN-induced neuroblastomas arising in the TATA/TATA background, but not in the lmo1–/– background, compared with the GATA/GATA zebrafish. (B) Relative mRNA expression levels of the mesenchymal neuroblastoma phenotype marker fn1a in neuroblastoma arising in zebrafish with the indicated genotypes (GATA/GATA, n = 4; lmo1–/–, n = 3; and TATA/TATA, n = 2). (C) Relative mRNA expression levels of NOTCH pathway genes, including jag1a, notch2, and hes2, in neuroblastomas arising in zebrafish from the indicated genotypes (GATA/GATA, n = 4; lmo1–/–, n = 3; and TATA/TATA, n = 2). (D) Heatmap of transcription factors exclusively upregulated in MYCN-driven neuroblastomas from the lmo1–/– line. TFs; transcription factors. |
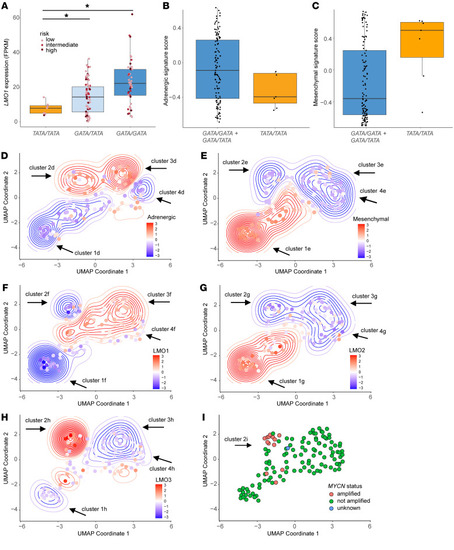
Human TATA/TATA neuroblastomas resemble zebrafish TATA/TATA tumors with low LMO1 expression and a mesenchymal phenotype.
(A) Relative LMO1 mRNA expression levels (in FPKM) in 124 human neuroblastoma samples with the indicated genotypes at rs2168101: TATA/TATA, GATA/TATA, or GATA/GATA. Each neuroblastoma sample is assigned to either low (pink), intermediate (light red) or high risk (purple). Statistical analysis was performed using the 2-tailed, Welch’s t test. *P < 0.005. (B and C) Adrenergic and mesenchymal gene set signature scores were generated using GSVA based on the previously published expression profiles by Von Groningen, et al. (8). Higher positive scores indicate upregulation of the corresponding signature, whereas, lower negative scores indicate downregulation. GATA/GATA and GATA/TATA tumors were combined into 1 group (blue) and compared with the TATA/TATA tumors (tan). (D and E) UMAP representing the whole transcriptome landscape of 124 human neuroblastoma samples (dots) in a 2-dimensional space combined with the adrenergic (D) and mesenchymal (E) gene signatures. Relative Z-score-transformed expression for each signature (according to the heat scale) is shown for each tumor (points) and overall density (contours). Clusters 1–4 represent tumors falling into similar density contours based on the adrenergic signature (D) or mesenchymal signature (E). (F–H) Combination of UMAP dimensionality reduction analysis and expression levels of LMO1 (F), LMO2 (G), and LMO3 (H). Relative Z-score of log2-transformed expression for LMO1 (F), LMO2, (G) or LMO3 (H) (according to the heat scale) is shown for each tumor (points) and overall density (contours). (I) MYCN status for all 124 human neuroblastoma samples. |