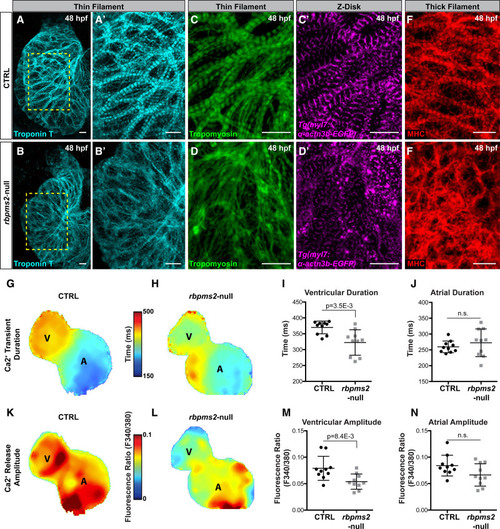
Myofibrillar disarray and calcium handling defects in rbpms2-null ventricular cardiomyocytes. A and B′, Representative confocal projections of ventricles in 48 hours postfertilization (hpf) control-sibling (CTRL) or rbpms2-null embryos immunostained with an anti-TroponinT antibody (CT3 [cardiac troponin T]) to visualize thin filaments. Regions demarcated in (A) and (B) are enlarged in (A′) and (B′). C and D′′, Confocal projections of ventricles in 48 hpf CTRL and rbpms2-null Tg(α-actn3b-EGFP) animals coimmunostained with antibodies that detect tropomyosin (CH1; green) to visualize thin filaments or GFP (magenta) to visualize Z-disks. E and F, Confocal projections of ventricles in 48 hpf CTRL and rbpms2-null embryos immunostained with an antibody that detects myosin heavy chain (MF20) to visualize thick filaments. For A–F, n=10 animals/group. Scale bars=10 μm. G–N, Color maps (G, H, K, and L) and dot plots (I, J, M, and N) of calcium transient duration (G–J) and calcium release amplitude (K–N) in the ventricle (G–I; K–M) and atrium (G, H, J, K, L, and N) of 48 hours postfertilization control-sibling (CTRL; G, I, J, K, M, and N) and rbpms2-null (H–J; L–N) hearts. Color code depicts localized calcium transient duration in milliseconds (G and H) or the ratiometric fluorescence indicator of calcium release amplitude (K and L). Each dot represents center-chamber measurements from one heart. n=10 hearts/group. Error bars show one SD. Statistical significance was determined by an unpaired, 2-tailed Student's t test assuming equal variances. Significant P values are shown. A indicates atrium; ns, not significant; and V, ventricle.