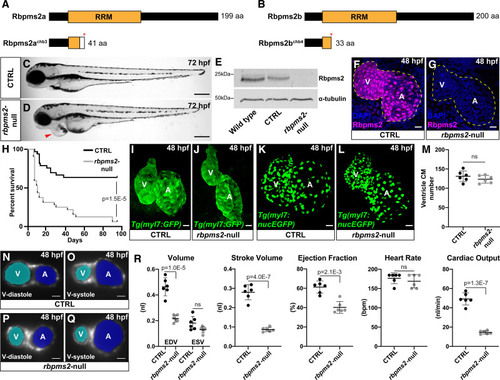
rbpms2a and rbpms2b are required redundantly for ventricular function in zebrafish. A and B, Schematic diagrams of the zebrafish Rbpms2a and Rbpms2b proteins (top) and the predicted protein products of the rbpms2achb3 and rbpms2bchb4 mutant alleles (bottom). The asterisks (*) mark the locations of premature stop codons within the RRMs (RNA-recognition motifs) caused by frame-shifting deletions. The white box in (A) shows the location of divergent amino acids before the stop codon. C and D, Representative brightfield images of control-sibling (C; CTRL) and rbpms2-null (rbpms2achb3/chb3; rbpms2bchb4/chb4; D) embryos at 72 hours postfertilization (hpf). Arrowhead highlights pericardial edema in the mutant. n=50/group. Scale bars=250μm. E, Western blot showing Rbpms2 levels in 48 hpf wild-type (WT), CTRL, and rbpms2-null embryos (top) relative to the loading control alpha-tubulin (bottom). F and G, Representative confocal projections of hearts in 48 hpf CTRL (F) and rbpms2-null (G) embryos immunostained with an anti-Rbpms2 antibody (magenta) and counterstained with DAPI (4'‚6-diamidino-2-phenylindole; blue). The dotted lines delineate the myocardium as ascertained from the Rbpms2 signal (F) or Tg(myl7:eGFP) reporter signal present in these animals (G; not shown). n=15/group. H, Kaplan-Meier plot for CTRL (n=33) and rbpms2-null (n=33) animals. Statistical significance was determined using a log-rank test. The significant P value is shown. I–L, Representative confocal projections of hearts in 48 hpf CTRL (I and K) or rbpms2-null (J and L) embryos carrying the myl7:GFP (I,J; n=10/group) or myl7:nucGFP (K and L) transgenes immunostained with an anti- GFP (green fluorescent protein) antibody. M, Dot plot showing ventricular cardiomyocyte (CM) numbers in CTRL (n=6) and rbpms2-null (n=6) hearts at 48 hpf. Error bars show one standard deviation. Statistical significance was determined by an unpaired, 2-tailed Student′s t test assuming equal variances. N–Q, Representative single-plane light sheet fluorescence microscopy images of hearts in 48 hpf CTRL (N and O) and rbpms2-null (P and Q) embryos carrying the myl7:GFP transgene. Images of hearts during ventricular diastole (N and P) or systole (O and Q) are shown with Cardiac Functional Imaging Network (CFIN) overlays of the atrial (blue) and ventricular (cyan) lumens. R, Dot plots showing end-diastolic volumes (EDV) and end-systolic volumes (ESV), stroke volumes, ejection fractions, heart rates, and cardiac outputs of ventricles in 48 hpf CTRL (n=6) and rbpms2-null (n=6) animals measured with CFIN. Error bars show one SD. Statistical significance was determined by Mann-Whitney U test or an unpaired, 2-tailed Student's t test assuming equal variances. Significant P values are shown. Scale bars=25 μm. A indicates atrium; aa, amino acid; ns, not significant; and V, ventricle.