
Fig. 2
- ID
- ZDB-FIG-230501-161
- Publication
- Jiang et al., 2022 - Parental mutations influence wild-type offspring via transcriptional adaptation
- Other Figures
- All Figure Page
- Back to All Figure Page
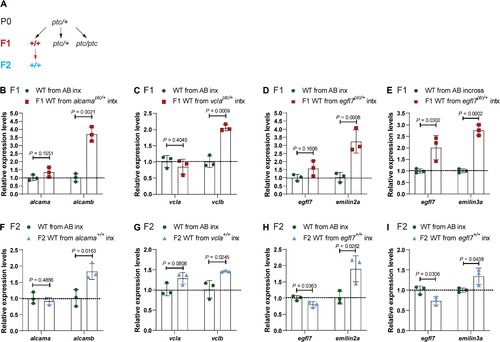
(A) Genetic crosses used to obtain wild-type (WT) embryos from TA-displaying heterozygous zebrafish and from subsequent incrosses. Black arrows indicate heterozygous intercrosses (intx); red arrow indicates subsequent wild-type incrosses (inx). (B) Relative mRNA levels of alcama and alcamb in 28 hpf wild-type embryos from AB incrosses and from alcamaptc/+ intercrosses. (C) Relative mRNA levels of vcla and vclb in 24 hpf wild-type embryos from AB incrosses and vclaptc/+ intercrosses. (D) Relative mRNA levels of egfl7 and emilin2a in 24 hpf wild-type embryos from AB incrosses and egfl7ptc/+ intercrosses. (E) Relative mRNA levels of egfl7 and emilin3a in 24 hpf wild-type embryos from AB incrosses and egfl7ptc/+ intercrosses. (F) Relative mRNA levels of alcama and alcamb in 28 hpf wild-type embryos obtained from AB incrosses and F1 alcama+/+ (i.e., wild types from alcamaptc/+ intercrosses) incrosses. (G) Relative mRNA levels of vcla and vclb in 24 hpf wild-type embryos obtained from AB incrosses and F1 vcla+/+ (i.e., wild types from vclaptc/+ intercrosses) incrosses. (H) Relative mRNA levels of egfl7 and emilin2a in 24 hpf wild-type embryos obtained from AB incrosses and F1 egfl7+/+ (i.e., wild types from egfl7ptc/+ intercrosses) incrosses. (I) Relative mRNA levels of egfl7 and emilin3a in 24 hpf wild-type embryos obtained from AB incrosses and F1 egfl7+/+ (i.e., wild types from egfl7ptc/+ intercrosses) incrosses. n = 3 biologically independent samples. Control expression levels were set at 1. Data are means ± SD, and a two-tailed Student’s t test was used to calculate P values. Ct values are listed in table S1. |