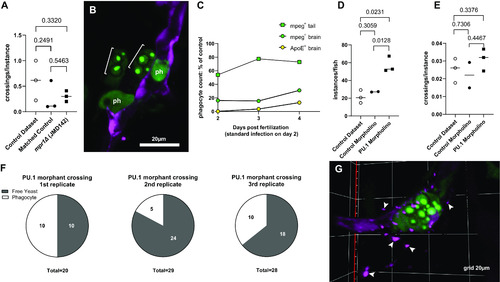
(A to F) Analysis of brain instances in mpr1Δ infection (A and B) and in PU.1 morphant larvae (C to F). (A) Crossing efficiency (number of crossings per instance in the whole experiment) in the original control data set of 77 larvae, matched control (JMD163) infection (closed circle), and mpr1Δ infection (closed square). The latter 2 sets were obtained simultaneously and consisted of 3 replicates of 10 larvae each. Pairwise analyses throughout the figure represent Welch’s t test of log-transformed ratios. (B) Intracellular mpr1Δ yeast cells (brackets) in the parenchyma after crossing the BBB; Ph, uninfected phagocytes. (C) Percent reduction in phagocytes in PU.1 morphants compared to larvae that received control morpholino. All mpeg+ cells decreased in the brain, but apoE+ cells decreased more. (D and E) Instances per fish (D) and crossing efficiency (E) comparison between the original control data set of 77 larvae, control morpholino (2 replicates of 10 larvae each), and PU.1 morpholino (3 replicates of 16, 15, and 13 larvae). (F) Status of crossing instances in PU.1 morphant infections; n = 3 replicates as in C and D; gray, extracellular; white, intracellular. (G) Example of endothelial breakdown in the brain during infection of PU.1 morphant. Infected Phagocyte inside a deteriorating vessel. White arrowheads indicate fragments of endothelial cytoplasm.
|
