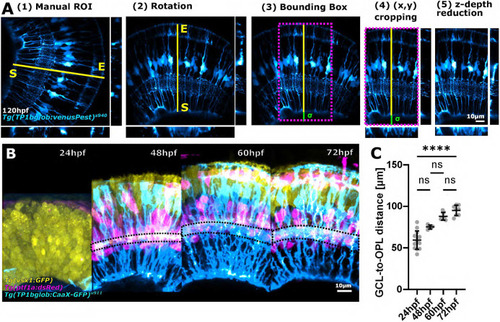
Fig. 3.
|
Image standardization facilitates global MG measurements across developmental time. (A) Workflow of the subregionTool. Semi-automatic subregion selection by (1) manual line ROI (yellow line) selection, which is then used to rotate the image (2), create a bounding box (3), crop the image using this bounding box (magenta dotted box) (4), and crop the image in the z dimension (5) (sigma=user-defined basal extension to allow for blood vessel inclusion). (B) Images from different animals and different transgenic reporter lines (representative images) overlaid with each other after processing with the subregionTool. (C) Measurement of GCL-to-OPL distance in age-matched samples [measured in Tg(TP1bglob:CaaX-GFP)u911; CoV 24 hpf 18.72%, 48 hpf 3.13%, 60 hpf 5.25%, 72 hpf 6.52%; P<0.0001; 24 hpf n=13 embryos, 48 hpf n=5 embryos, 60 hpf n=8 embryos, 72 hpf n=8 embryos; N=2 experimental repeats; Kruskal–Wallis test; mean±s.d.]. ns, not significant. |

