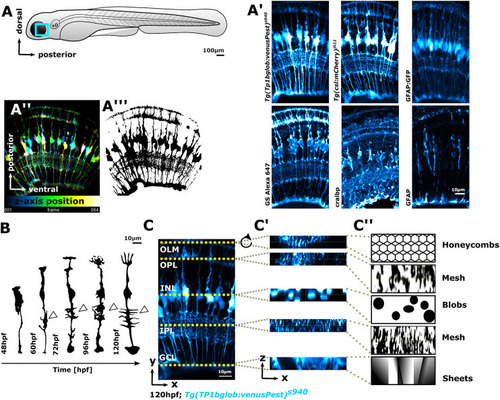
Fig. 2.
|
MG cells have a complex shape that makes them challenging to analyse computationally. (A) Imaging of MG was conducted in the ventro-temporal zebrafish retina to standardize the ROI. (A′) MG can be visualized with a variety of transgenic reporter lines or immunohistochemistry markers. (A″) Depth-coded MIP of MG stable transgenic line. (A‴) Data as in A″ after image segmentation. (B) Hand-drawn schematic of individual MG cell morphological maturation during early development, showing elaboration of subregions and an increase in protrusions (arrowheads) based on observed biological data (MacDonald et al., 2017). (C) MIP micrograph with yellow dotted lines indicating the apicobasal position of retinal layers. (C′) Resliced/transformed sections at the position of the yellow dotted lines, illustrating that cell subregions have cellularly and computationally distinct properties along the apicobasal axis. (C″) Manually drawn schematic of how MG subregions features could be described for computational analysis in terms of shape. In all images, apical is the top and basal is the bottom of the image. INL, inner nuclear layer; OLM, outer limiting membrane. |

