
Fig. 3.
- ID
- ZDB-FIG-230420-10
- Publication
- Liu et al., 2022 - Chemokine signaling synchronizes angioblast proliferation and differentiation during pharyngeal arch artery vasculogenesis
- Other Figures
- All Figure Page
- Back to All Figure Page
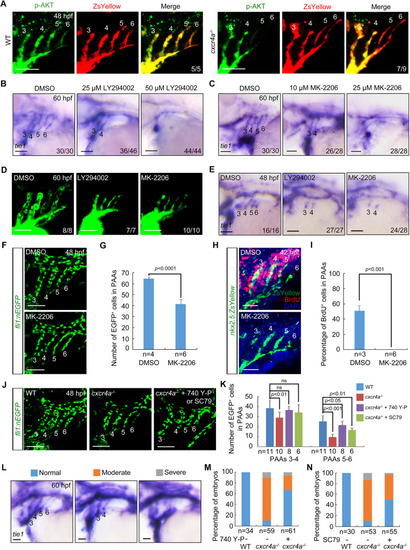
Cxcr4a regulates PAA development through the PI3K/AKT cascade. (A) AKT phosphorylation levels were decreased in PAAs 5 and 6 of cxcr4a−/− mutants. Control and cxcr4a−/−;Tg(nkx2.5:ZsYellow) embryos were immunostained using anti-p-AKT (green) and anti-ZsYellow (red) antibodies. (B,C) Wild-type embryos were treated with the PI3K inhibitor LY294002 (B) or the AKT inhibitor MK-2206 (C) from 18 hpf. Embryos were then harvested for in situ hybridization. (D) Live confocal images of Tg(nkx2.5:ZsYellow) embryos with 25 μM LY294002 or 10 μM MK-2206 from 18 to 60 hpf. (E) Embryos were treated with 25 μM LY294002 or 10 μM MK-2206 from 18 hpf until harvest for in situ hybridization. (F,G) Quantitative analysis of the number of PAA cells in embryos treated with either DMSO or 10 μM MK-2206. Representative pictures are shown in F and the number of PAA cells for each group is shown in G. Error bars indicate the s.d. of three biological replicates. (H,I) Confocal images of embryos treated with DMSO or 10 μM MK-2206 from 18 to 48 hpf. PAA angioblasts were labeled using antibody against ZsYellow (green), and proliferating cells were visualized by BrdU immunofluorescence (red) (H). Nuclei were stained with DAPI (blue). Ratios of BrdU-positive PAA cells were calculated and are shown in I. Error bars indicate the s.d. of three biological replicates. (J,K) Reduced cell number could be partially rescued by PI3K/AKT re-activation. cxcr4a−/− mutants were exposed to the PI3K agonist 740 Y-P (1 μM) or the AKT agonist SC79 (0.5 μM) from 18 to 48 hpf. Representative images are shown in J and quantified cell numbers are shown in K. Error bars indicate the s.d. of three biological replicates. Unpaired Student's t-test; ns, not significant. (L-N) cxcr4a−/− mutants were treated with 740 Y-P or SC79 from 18 to 60 hpf. Different phenotypes of PAAs were visualized using tie1 expression (L). The percentages of affected embryos are shown in M,N. Scale bars: 50 μm. |