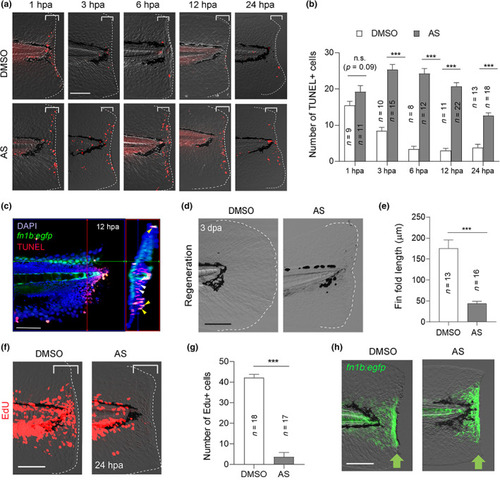
Phenotype caused by the PI3Kγ inhibitor, AS. (a) Terminal deoxynucleotidyl transferase dUTP nick end labeling (TUNEL) analysis of cell death at different stages of fin fold regeneration using dimethyl sulfoxide (DMSO)‐ and AS‐treated larvae. Scale bar, 50 μm. (b) Quantification of TUNEL‐positive cells in the injured site (bracketed areas) in (a). The data at 12 hpa (hours post amputation) in Figure 1bwere also used for statistical analysis. (c) Confocal image of the fin fold of Tg(fn1b:egfp) (green) at 12 hpa wherein apoptotic cells were detected by TUNEL staining (red). Right panel, the longitudinal transverse optical section at a plane indicated by the red line. DAPI, nuclear staining with 4′,6‐diamidino‐2‐phenylindole dihydrochloride (0.1 mg/mL). The enhanced green fluorescent protein (EGFP) fluorescence marks the epithelial cells expressing fn1b. Yellow and white arrowheads indicate representative epithelial and mesenchymal cells, respectively. Scale bar, 50 μm. (d) Fin fold regeneration in DMSO‐ and AS‐treated larvae at 3 dpa. Scale bar, 50 μm. (e) Quantification of the regenerated fin fold length from the posterior to the end of notochord in (d). (f) Detection of proliferating cells by 5‐ethynyl l‐2′‐deoxyuridine (EdU) incorporation in the DMSO‐ and AS‐treated larvae during 0–24 hpa. Scale bar, 50 μm. (g) Quantification of the number of EdU‐positive cells beneath the amputation site (bracketed areas) in (f). (h) Confocal image of the fin fold of Tg(fn1b:egfp) at 12 hpa in the DMSO‐ and AS‐treated larvae. Scale bar, 50 μm. (b, e, g) Data are presented as the mean ± SEM and analyzed by Student's t‐test; ***p < 0.001, n.s., not significant