
Fig. 7
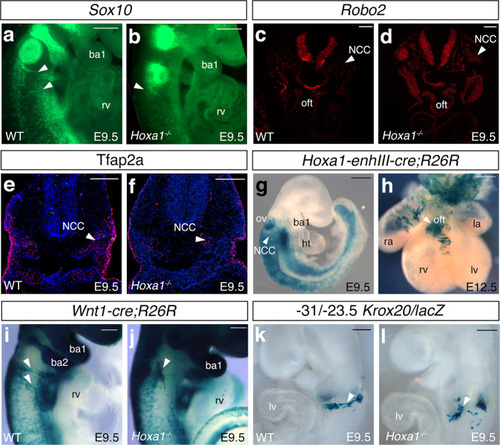
a, b RNA-FISH showing the expression of Sox10 (green) in wild-type (WT) (a) and Hoxa1−/− (b) E9.5 embryos. Lateral view of Sox10 staining revealed a decrease of expression in the migrating neural crest cells (arrowheads). c, d, RNA-FISH showing Robo2 expression (green) in wild-type (c) and Hoxa1−/− (d) E9.5 embryos. Expression of Robo2 is higher in Hoxa1−/− than wild-type littermates. e, f Cross-sections of wild-type (e) and Hoxa1−/− embryos (f) immunostained with anti-Tfap2-alpha antibody (red). Note the reduction of Tfpa2-alpha positive cells in the mutant (arrowhead). g, hHoxa1-lineage visualized by X-gal staining of Hoxa1-enhIII-cre;R26R-lacZ embryos. g, Lateral view showing β-galactosidase activity in migrating neural crest cells (NCC; arrowhead) in transgenic embryo at E9.5. h, At E12.5, β-galactosidase activity is observed in the outflow tract (OFT). i, j, Whole-mount X-gal staining of Wnt1-cre;R26R-lacZ WT (i) and Hoxa1−/− (j) E9.5 embryos. Migration of neural crest cells (arrowhead) is disrupted in Hoxa1−/− embryos (j) compared to WT (i) littermate embryos. k, l Whole-mount X-gal staining of −31/−23.5 Krox20/lacZ WT (k) and Hoxa1−/− (l) E9.5 embryos. Migration of β-galactosidase-positive cells (arrowhead) is disrupted Hoxa1−/− (l) compared to WT (k) littermate embryos. ba: branchial arch; ht, heart tube; la, left atrium; lv, left ventricle; NCC, neural crest cells; ov, otic vesicle; oft, outflow tract; ra, right atrium; rv, right ventricle. Data are representative of 3 independent embryos of each genotype. Scale bars: 100 μm (c–g), 200 μm (a, b, h, l). |