
Fig. 6
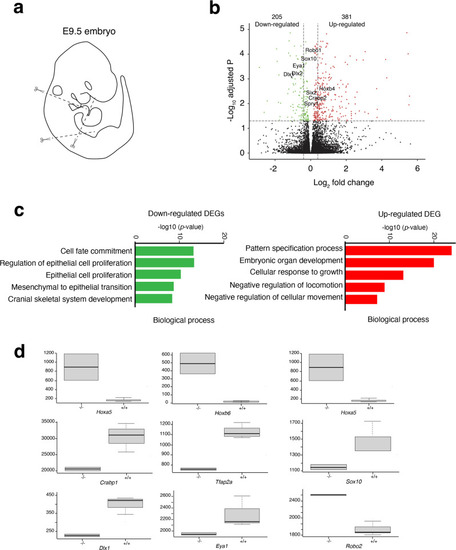
a Scheme showing which region was used to perform RNA-seq analysis on Hoxa1−/− vs WT embryos. b Volcano plot of fold changes and corresponding FDR (False Discovery Rate) value for each RNA after comparison of Hoxa1−/− and WT embryos. The red and green dots represent RNAs with fold change >2.0 and FDR < 0.05. The black dots represent RNAs with fold change <2.0 and FDR > 0.05. The statistical test used for data analysis is package R EnhancedVolcano. c Gene ontology (GO) analysis performed with ClusterProfiler system showing enrichment of up-regulated (red) and down-regulated (green) genes in the mutant with ranked by −log10 (p-value). The statistical test used for data analysis is package R clusterProfiler. d Boxplot of FPKM (Fragments Per Kilo base of transcript per Million mapped fragments) expression value for nine selected DE genes in RNA-seq. Boxes and whiskers (min to max) show the values of lower and upper quartile. The y-axis represents the FPKM expression level, and the x-axis the genotype. Data are shown as mean ± SEM. Data are representative of three biologically independent experiments. |