|
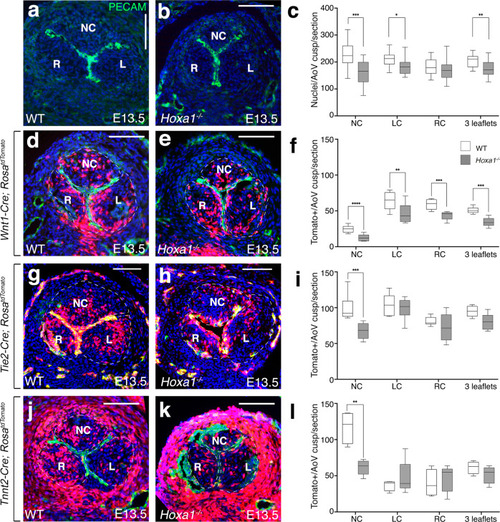
Analysis of cell lineage contribution in Hoxa1-null mice. a, b Transversal sections of E13.5 hearts immunostained with an endothelial marker (anti-Pecam antibody, green) and DAPI staining for nuclei (blue). Note the smaller non-coronary (NC) leaflet in Hoxa1−/− (b) compared with WT (a) embryos. c Total nuclei were counted in the three forming aortic valve leaflets from Hoxa1−/− (n = 20) and WT (n = 18) embryos at E13.5 spanning a 180 μm depth (***p = 0.0006; **p = 0.0009; *p = 0.01). d–l Fate-mapping of the neural crest-, endothelial- and second heart field-lineages in the aortic valves of WT (d, g, j), and Hoxa1-null (e, h, k) embryos at E13.5. Tomato-reporter is visualized in red and nuclei (DAPI) appear in blue. d, e Immunofluorescence staining using Wnt1-Cre;RosatdTomato/+ reporter mice shows a decrease in the number of neural crest derivatives in absence of Hoxa1. f Quantification of neural crest-derived cells demonstrates significant decrease in Hoxa1−/− (n = 5) compared to WT (n = 6) littermate embryos (****p = 0.008;***p = 0.004; **p = 0.03). Area of interest is indicated by a dotted line. g, h Immunofluorescence staining using Tie2-Cre;RosatdTomato/+ reporter mice shows a decreased contribution of endothelial lineage to the non-coronary leaflet of Hoxa1−/− (h) compared to WT (g) littermates. i Quantification confirms the decreased number of endothelial-derived cells in the non-coronary leaflet in Hoxa1−/− (n = 6) compared to WT (n = 6) littermates (***p = 0.002). Area of interest is indicated by a dotted line. j, k Immunofluorescence staining using Tnnt2-Cre;RosatdTomato/+ reporter mice demonstrates a decreased contribution of the second heart field lineage to the non-coronary leaflet in Hoxa1−/− (k) compared to WT (j) littermates. l Quantification confirms the reduced number of second heart cells-derived cells in the non-coronary leaflet in Hoxa1−/− (n = 5) compared to WT (n = 4) littermates (**p = 0.01). Area of interest is indicated by a dotted line. Data are shown as mean ± SEM. Boxes and whiskers (min to max) show the values lower than the 25 percentile and greater than the 75 percentile. Statistical values were obtained using the Mann-Whitney test. LC: left coronary leaflet; NC: non-coronary leaflet; RC: right coronary leaflet. Scale bars: 100 μm (a, b, d, e, g, h, j, k). Source data are provided as a Source data file.
|