
Figure 9
- ID
- ZDB-FIG-230324-15
- Publication
- Leyhr et al., 2023 - Enhanced contrast synchrotron X-ray microtomography for describing skeleton-associated soft tissue defects in zebrafish mutants
- Other Figures
- All Figure Page
- Back to All Figure Page
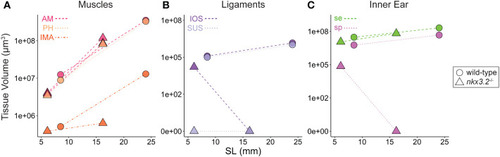
Volume measurements of 3D segmented soft tissues. Volume measurements of muscles (A), Weberian ligaments (B), and inner ear sacs (C). Circles indicate wild-type tissues, while triangles indicate nkx3.2 -/- tissues. Each point represents a single tissue volume measurement. Dotted lines connect corresponding tissues from 1mpf and 2mpf zebrafish of the same genotype to approximate growth trajectories. Different tissues are indicated by individual colors and line styles in agreement with the color codes used in the previous figures. Y-axes are log- or pseudolog-scaled. X-axes display standard length (mm). AM, adductor mandibulae; PH, protractor hyoideus; IMA, intermandibularis anterior; IOS, interossicular; SUS, suspensor; se, sinus endolymphaticus; sp, sinus perilymphaticus. |