Fig. 1
- ID
- ZDB-FIG-230228-75
- Publication
- Bhandari et al., 2023 - Loss of pex5 sensitizes zebrafish to fasting due to deregulated mitochondria, mTOR, and autophagy
- Other Figures
- All Figure Page
- Back to All Figure Page
|
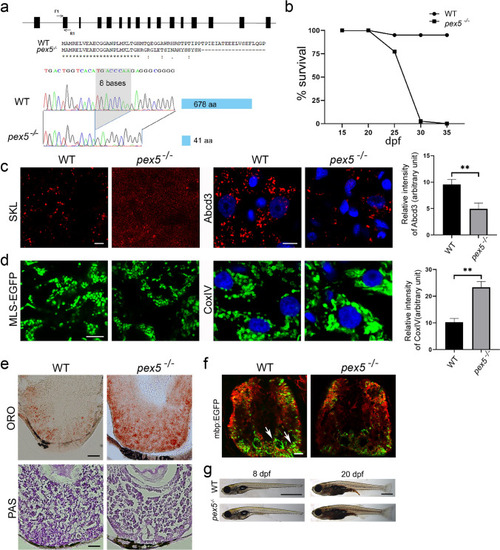
Loss of Pex5 in zebrafish induces liver defects and myelination abnormality due to the decreased peroxisome number. a Schematic view of the genomic structure of pex5 in zebrafish is shown with 16 exons in black rectangles. F1 and R1 indicate the position and direction of the primer sequences that were used for the clustered regularly interspaced palindromic repeat/caspase 9 (CRISPR/Cas9)-mediated gene inactivation. A partial amino-terminal sequence of WT Pex5 is compared to that of Pex5 mutant protein. Note that the 8-base pair deletion shown in the sequencing chromatogram of the pex5 gene is predicted to translate a truncated version of the Pex5 mutant protein comprised only 41 amino acids with a stretch of unrelated carboxy-terminal sequences. b Survival curve for pex5−/− under normal feeding conditions. Heterozygous pex5+/− zebrafish were incrossed, and the percentage of survived larvae per genotype at the indicated developmental times was plotted with assumption of Mendel’s segregation ratios. c Peroxisomes are shown in the liver sections of WT and pex5−/−. The RFP-SKL expression from the Xla.Eef1a1:RFP-SKL transgene was used as a surrogate to detect the subcellular localization of the peroxisomal matrix proteins. The expression levels of endogenous PMP70 proteins detected by immunofluorescence were shown to illustrate an abundance of peroxisome membrane proteins that are independently incorporated in the peroxisome membrane from the matrix-import pathway. Scale bar = 5 μm. Graph shows quantified signal intensity of Abcd3 and presented as the average with error bars indicating standard deviation. Statistical significance was determined using the Student’s t test in Microsoft Excel; * and ** indicate p values < 0.05 and < 0.01, respectively. d Mitochondria are shown in the liver sections of WT and pex5−/−. Expression of mitochondria-targeted enhanced green fluorescent protein (EGFP) (MLS-EGFP) was used to detect the general shape of mitochondria, whereas immunofluorescence of a component of the mitochondrial respiratory chain complex IV (CoxIV) was performed to reveal the differential expression of an endogenous mitochondria-targeted protein. Scale bar = 5 μm. Graph shows quantified signal intensity of CoxIV and presented as the average with error bars indicating standard deviation. Statistical significance was determined using the Student’s t test in Microsoft Excel; * and ** indicate p values < 0.05 and < 0.01, respectively. e Neutral lipids and glycogen are shown by performing Oil Red O and PAS staining, respectively, in the liver sections of WT and pex5−/−. Scale bar = 50 μm. f Neuronal myelination using Tg(mbp:EGFP) transgenic zebrafish was compared between WT and pex5−/−. Red immunofluorescence for acetylated tubulin was used to locate the differentiating neurons in the zebrafish trunk. Arrows indicate myelinated neurons. Scale bar = 50 μm. g Representative pictures of the WT and pex5−/− at 8 and 20 dpf as indicated are shown in lateral views with anterior to the left. Scale bar = 1 mm |

