
Figure 4
- ID
- ZDB-FIG-230228-402
- Publication
- Naef et al., 2023 - Converging Role for REEP1/SPG31 in Oxidative Stress
- Other Figures
- All Figure Page
- Back to All Figure Page
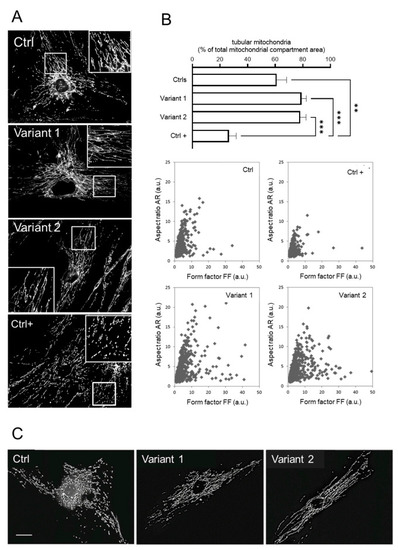
Mitochondrial morphology investigations in skin fibroblasts. (A) The mitochondrial network analysis by fluorescence microscopy showed hyperfused tubules in REEP1 mutated fibroblasts as compared with control. A control line under the effect of FCCP was used as positive control of the fragmented network (Ctrl +). (B) Morphometric analysis showing a significant increase in tubular mitochondria in patients. Statistics was assessed by ordinary ANOVA test (one-way ANOVA). ** p < 0.01; *** p < 0.001. Computer-assisted morphological analyses of mitochondrial AR plotted as function of FF showed in SPG31 patients’ cells higher values for both FF and AR (tubular and hyperfused mitochondria). Ctrl + indicates a positive control with very low levels of fragmented mitochondria. (C) Representative fluorescence microscopy images of MitoTracker Red in fibroblasts 30 min after treatment with 2 µM FCCP. Unlike the control line, no fragmented mitochondria were observed in both mutated fibroblasts. Scale bar: 20 µm. |