
Figure 2
- ID
- ZDB-FIG-230228-400
- Publication
- Naef et al., 2023 - Converging Role for REEP1/SPG31 in Oxidative Stress
- Other Figures
- All Figure Page
- Back to All Figure Page
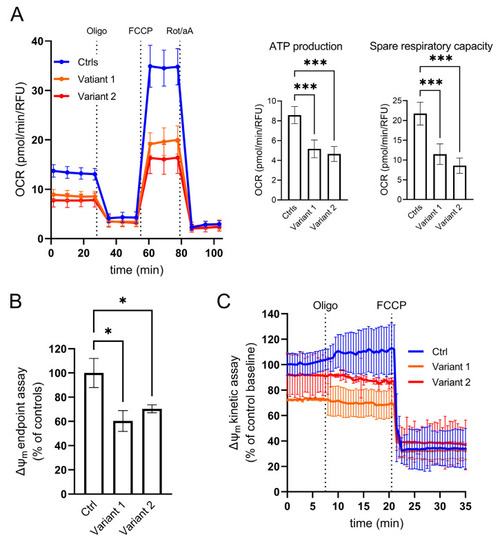
Cellular analysis of mitochondrial function. (A) Micro-oxygraphy track showing a reduced OCR in mutated cell lines, which is clearly evident after FCCP injection, reflecting a deficient spare respiratory capacity. Data represent mean ± SEM of controls (n = 3) and patients (n = 2 for each mutation). Two independent experiments were run with four technical replicates for each cell line. (B–C) Mitochondrial membrane potential profiles evaluated both in terms of TMRM probe accumulation and membrane potential maintenance. (B) End-point assay indicating a mitochondrial membrane depolarization in mutated fibroblasts reported as percentage of controls. Data were normalized by DAPI staining as a function of cell number. (C) Kinetic track demonstrates the ability of REEP1 cultured skin fibroblasts to maintain polarized mitochondrial membrane after oligomycin blocking proton transit through Complex V, highlighting any leakage of the inner mitochondrial membrane. FCCP was added at the end of the experiments to fully depolarized mitochondrial to demonstrate the specificity of measurements. Data represent mean ± SEM of controls (n = 3) and patients (n = 2 for each mutation). A technical triplicate was assessed for endpoint assay, whereas for kinetic analyses, cell lines were acquired in an independent experiment recording 10 different ROIs/field over time. For all the reported experiments, statistics were assessed by ordinary ANOVA test (one-way ANOVA). * p < 0.05; *** p < 0.001. |