
Figure 1
- ID
- ZDB-FIG-230228-399
- Publication
- Naef et al., 2023 - Converging Role for REEP1/SPG31 in Oxidative Stress
- Other Figures
- All Figure Page
- Back to All Figure Page
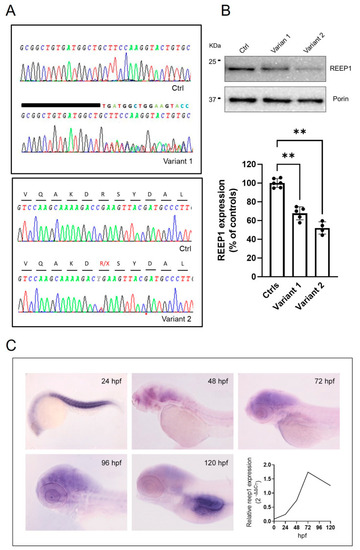
Molecular studies in the analyzed disease models. (A) Genetic studies of DNA from mutated fibroblasts show the electropherogram of exon 5 flanking the c.401_409dup9del19 and c.337C > T mutations. A wild-type REEP1 sequence is also reported as a reference. (B) Representative WB and quantification of REEP1 protein expression levels related to both mutant cell lines and control. Porin expression was used as a loading control. A significant reduction in REEP1 protein expression was observed with residual levels between 50 and 70% compared to controls. Three different control fibroblasts (in technical duplicate) and two subjects for each mutation (in technical triplicate) were analyzed and plotted both as individual values and histograms with mean and SD. ANOVA test (one-way ANOVA) was used to compare the mean levels of each mutated line with the control mean. ** p < 0.01. (C) Spatial-temporal expression of reep1 mRNA during zebrafish embryogenesis. WISH of zebrafish reep1 was performed at different developmental stages (from 24 to 120 hpf), and qRT−PCR analysis showed reep1 developmental relative expression from 0 hpf to 120 hpf in WT zebrafish. |
| Gene: | |
|---|---|
| Fish: | |
| Anatomical Terms: | |
| Stage Range: | 1-cell to Day 5 |