
Fig. 6
- ID
- ZDB-FIG-230227-6
- Publication
- Bump et al., 2022 - Osteoblasts pattern endothelium and somatosensory axons during zebrafish caudal fin organogenesis
- Other Figures
- All Figure Page
- Back to All Figure Page
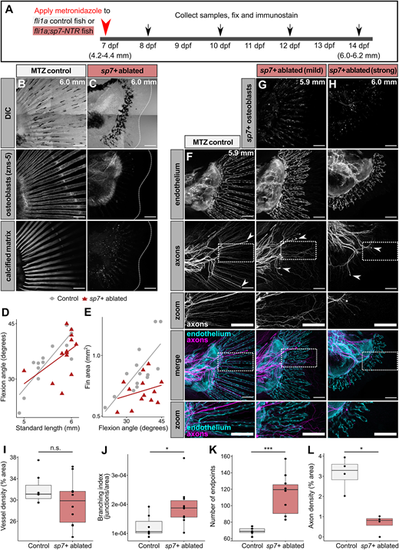
Osteoblasts are required for endothelial remodeling and axon patterning in the developing caudal fin. (A) Diagram illustrating experimental scheme of sp7+ osteoblast ablation in developing zebrafish. (B,C) Representative confocal projections of MTZ-treated control [Tg(fli1a:EGFP)] or osteoblast-ablated [Tg(fli1a:EGFP);Tg(sp7:mCherry-NTR)] caudal fins fixed at the indicated stages and stained for markers of osteoblasts (zns-5 antibody) and calcified matrix Alizarin Red S. Dotted lines denote caudal fin margins. Note the lack of zns-5+ osteoblasts and calcified matrix within the osteoblast ablated fin. (D,E) Developmental metrics in control and sp7+-ablated fins. Control fli1a+ fish, n=14. sp7+ ablated fish, n=13. SL/flexion slope between genotypes was not significantly different (P=0.154; ANCOVA). Flexion/fin area between genotypes was significantly different (P=0.00102; ANCOVA). Representative results from a single independent trial. (F-H) Representative confocal projections of MTZ-treated control [Tg(fli1a:EGFP)] or osteoblast-ablated [Tg(fli1a:EGFP);Tg(sp7:mCherry-NTR)] caudal fins fixed at the indicated stages and stained for axons (acetylated tubulin antibody). White arrowheads indicate lateral line (LL) axons. Note the disorganized appearance of axons and endothelium in the absence of sp7+ osteoblasts. ‘Zoom’ panels show high-magnification images of the boxed areas above. (I-K) Box plots of vessel density, branching index and number of endpoints between treatment groups. Wilcoxon rank sum test results: vessel density, P=0.31; branching index, P=0.033; number of endpoints, P=0.00074. Control fli1a+ fish, n=7 (mean SL=5.96 mm±0.05 s.d.). sp7+ ablated fish, n=10 (mean SL=5.87 mm±0.15 s.d.). Representative results from a single independent trial. (L) Box plot of axon density between control and osteoblast-ablated groups. Wilcoxon rank sum test between groups, P=0.02857. Control fli1a+ fish, n=4 (mean SL=5.9 mm±0.00 s.d.). sp7+ ablated fish, n=4 (mean SL=5.93 mm±0.09 s.d.). *P<0.05, ***P<0.001. n.s., non-significant. Data are representative of at least two biological replicates. Scale bars: 100 μm (B,C,F-H). |