
Figure 3
- ID
- ZDB-FIG-230211-150
- Publication
- Oderberg et al., 2023 - Biliary epithelial cells are facultative liver stem cells during liver regeneration in adult zebrafish
- Other Figures
- All Figure Page
- Back to All Figure Page
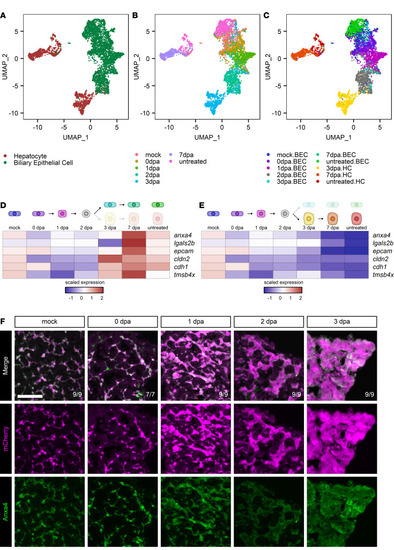
Single-cell sequencing of biliary-mediated regeneration.
(A–C) UMAP plots of hepatocytes and BECs during regeneration from hepatocyte ablation. Cells are colored by cell type (A), time point (B), and cell state (C). (D and E) Heatmaps of the average expression in selected cell states for each gene. The scaled expression values are average expression values that have been normalized to the minimum and maximum values in each row. The color key from blue to red indicates low to high scaled expression levels, respectively. Data are shown for the biliary branch (D) and hepatocyte branch (E). Biliary markers initially decrease and then only return along the biliary branch. (F) Immunofluorescence showing mCherry (magenta) and Anxa4 (green) signal as markers for BEC origin and BEC identity, respectively, in adult livers in animals regenerating from hepatocyte ablation. Time points shown are mock (n = 9), 0 dpa (n = 7), 1 dpa (n = 9), 2 dpa (n = 9), and 3 dpa (n = 9). Number of animals resembling the representative image are in white in the lower right corner of each image. Scale bars: 50 μm. |