
Figure 1
- ID
- ZDB-FIG-230211-148
- Publication
- Oderberg et al., 2023 - Biliary epithelial cells are facultative liver stem cells during liver regeneration in adult zebrafish
- Other Figures
- All Figure Page
- Back to All Figure Page
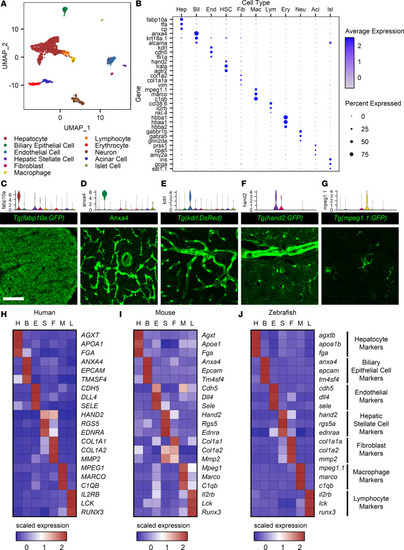
A single-cell atlas for the zebrafish liver.
(A) UMAP plot showing 11 cell type clusters identified. (B) Dot plot for the 3 key markers used in cluster identification for each cell type cluster. Gene expression is represented by log-transformed normalized UMI counts, and the average expression is the mean of expression values for all cells in a given cluster. The color key from gray to blue indicates low to high expression levels, respectively. The size key indicates the fraction of cells in an individual cluster expressing a specific gene. (C–G) Paired violin plots and immunofluorescence (green) for fabp10a (C), anxa4 (D), kdrl (E), hand2 (F), and mpeg1.1 (G). Scale bars: 50 μm. (H–J) Heatmaps displaying scaled expression for human (H), mouse (I), and zebrafish (J) orthologous genes. H, hepatocyte; B, biliary epithelial cell; E, endothelial cell; S, hepatic stellate cell; F, fibroblast; M, macrophage; and L, lymphocyte. Scaled expression values represent average expression values normalized to the minimum and maximum values in each row. The color key from blue to red indicates low to high scaled expression levels, respectively. Cell type markers are conserved across species. |