
Figure 3
- ID
- ZDB-FIG-230124-190
- Publication
- Mhalhel et al., 2023 - Zebrafish: A Model Deciphering the Impact of Flavonoids on Neurodegenerative Disorders
- Other Figures
- All Figure Page
- Back to All Figure Page
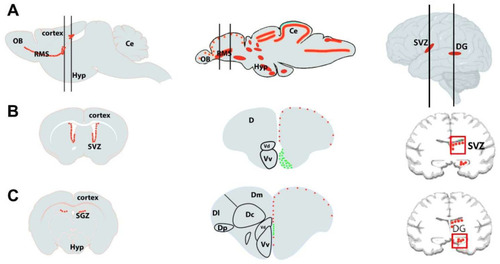
Schematic drawing of (A) a sagittal section of rodent (left), zebrafish (middle), and human (right) brains with the main neurogenic niches indicated in red. The mammalian brain displays only two main neurogenic niches: the subventricular zone (SVZ) of the lateral ventricles and subgranular zone (SGZ) of the dentate gyrus (DG) of the hippocampus. The black lines correspond to coronal sections. (B,C): Transversal sections through the brain, marking the major neurogenic niches of the respective species shown in A. In zebrafish, the red dots correspond to slow-cycling progenitors (mainly radial glial cells, type 2), and the green ones to fast-cycling progenitors (mainly neuroblasts, type 3). OB, olfactory bulbs; Ce, cerebellum; D, telencephalic dorsal area; Hyp, hypothalamus; RMS, rostral migratory stream; Dm, dorsomedial zone of the dorsal telencephalon; Dc, central zone of the dorsal telencephalon; Dl, lateral zone of the dorsal telencephalon; Dp, posterior zone of the dorsal telencephalon; Vd, dorsal nucleus of the ventral telencephalon; Vv, ventral nucleus of the ventral telencephalon. This figure is adapted from [296,297]. |