
Figure 4
- ID
- ZDB-FIG-230123-20
- Publication
- Sabharwal et al., 2022 - Genetic therapy in a mitochondrial disease model suggests a critical role for liver dysfunction in mortality
- Other Figures
-
- Figure 1
- Figure 2
- Figure 2 - figure supplement 1
- Figure 2 - figure supplement 2
- Figure 2 - figure supplement 3
- Figure 3
- Figure 3 - figure supplement 1
- Figure 4
- Figure 4 - figure supplement 1
- Figure 5
- Figure 5 - figure supplement 1
- Figure 5 - figure supplement 2
- Figure 6
- Figure 7
- Figure 7 - figure supplement 1
- Figure 8
- All Figure Page
- Back to All Figure Page
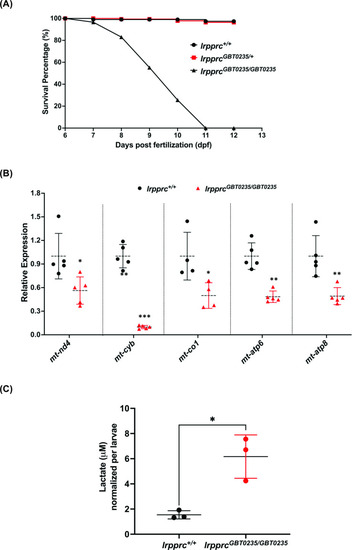
rpprcGBT0235/GBT0235 mutants recapitulate the hallmarks of LSFC. (A) Survival percentage of lrpprc+/+, lrpprcGBT0235/+, and lrpprcGBT0235/GBT0235. Data is represented from independent experiments (N=5 pairs) (Figure 4—source data 1) (B) Relative expression of mtDNA transcripts in the lrpprcGBT0235/GBT0235 and lrpprc+/+ assessed by qRT-PCR. Mitochondrial transcripts were normalized to eef1a1l1 transcript levels. The black circle represents wild-type and the red triangle represents homozygous mutants. Each data point represents embryos from the different clutch. Error bars are represented as SD (*: p-value < 0.05, **: p-value < 0.01, ***: p-value < 0.001). p-Values were determined by unpaired t-test. p-values (mt-nd4=0.0248; mt-cyb=0.0001; mt-co1=0.0371; mt-atp6=0.0011; mt-atp8=0.0089). (Figure 4—source data 1) (C) Relative lactate levels in the whole-body lysates of wild-type and lrpprc homozygous siblings. Lactate levels were normalized to the number of larvae. Error bars are represented as SD (*: p-value = 0.0392). p-Value was determined using the unpaired t-test. (Figure 4—source data 1). |
| Genes: | |
|---|---|
| Fish: | |
| Anatomical Term: | |
| Stage: | Day 6 |
| Fish: | |
|---|---|
| Observed In: | |
| Stage Range: | Day 6 to Days 7-13 |