
Fig. 1
- ID
- ZDB-FIG-230116-9
- Publication
- Sy et al., 2023 - An optofluidic platform for interrogating chemosensory behavior and brainwide neural representation in larval zebrafish
- Other Figures
- All Figure Page
- Back to All Figure Page
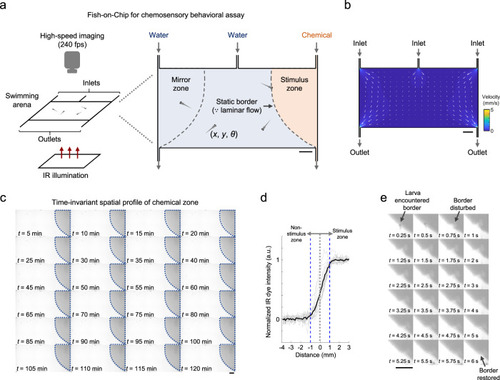
a Schematics of the chemosensory behavioral assay. Zebrafish larvae swimming in a two-dimensional arena (60 mm × 30 mm × 1.5 mm) are imaged at high speed (240 fps) under infrared (IR) illumination in the absence of visible light. A chemical zone (stimulus zone) is created and maintained by a constant slow inflow of a given chemical (dissolved in water) via the rightmost fluid inlet. Assays in which all zones are filled by water streams serve as control. The symmetrical mirror zone serves as an additional control for obtaining baseline behaviors when infused by water. The laminar flow maintains a static border between the zones. The coordinates (x, y) and orientation (θ) of the center of the head are tracked and analyzed for each larval zebrafish. b Simulated fluid velocity profile in the swimming arena. Vectors show the direction of flow at the respective locations, with length scaling according to the relative magnitude of velocity. The absolute magnitude of velocity is color-coded according to the color scale bar. c Time-lapsed images (contrast-enhanced) showing the chemical zone border in the presence of larval zebrafish with an IR dye flowing in via the rightmost fluid inlet in a swimming arena identical to that used for chemosensory behavioral assays. Dotted lines in each image outline the same border. Note the subtle differences between the images showing zebrafish larvae navigating the arena. d Individual line profiles (gray) of IR dye intensity along normal vectors at different spatial locations of the chemical border (see “Methods”) and their mean (black). Positive and negative values on the x axis indicate distances from the border further into and away from the stimulus side, respectively. Blue dashed lines mark ± 1 mm from the border. e Time-lapsed images (contrast-enhanced) showing transient border disturbance and restoration in an example larval zebrafish border-crossing event. Scale bars in a–c and e: 0.5 cm. Source data are provided as a Source Data file. |