
Fig. 2
- ID
- ZDB-FIG-230116-10
- Publication
- Sy et al., 2023 - An optofluidic platform for interrogating chemosensory behavior and brainwide neural representation in larval zebrafish
- Other Figures
- All Figure Page
- Back to All Figure Page
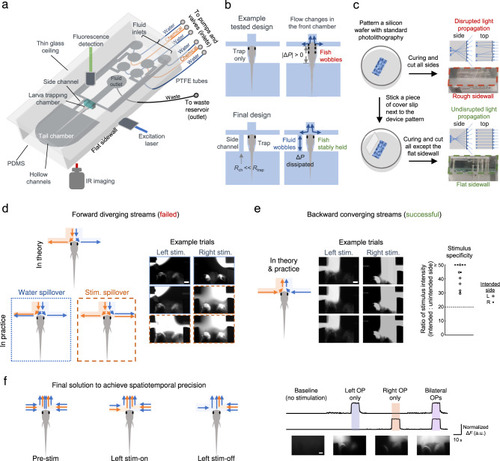
a Schematics of the PDMS microfluidic (µfluidic) module with a larval chamber, a tail chamber, and a fluid delivery front chamber, which was made compatible with whole-brain and tail imaging. b Upper panel: when there are flow changes in the front chamber, changes in pressure difference across the front and tail chambers (ΔP) leads to larva wobbling. Lower panel: with the addition of a side channel that has a much smaller fluid resistance (Rch) than that of the trapping chamber (Rtrap), fluid in the side channel dissipates the changes in ΔP and the larva is stably held. Also see Supplementary Fig. 2e, f. c In contrast to rough sidewalls, the flat sidewall ensures undisrupted excitation laser propagation and light sheet formation. The sidewalls are outlined by dashed lines. Schematic side and top views of light ray propagations are shown. d Left panel: schematic depictions of the theoretical and actual fluid segregation using forward diverging streams (left-side stimulation illustrated). Blue: water. Orange: chemical (Stim.). Arrows indicate the flow directions. Right panel: example images showing contralateral spillover of chemical or water (specified using corresponding image outlines). e Left panel: schematic depictions of the fluid segregation using backward converging streams (left-side stimulation illustrated). Middle panel: example images. Right panel: the ratio of stimulus intensity (intended side vs. unintended side) in test trials (n = 12 trials in 2 larvae), quantified with fluorescent imaging using 100 µM fluorescein in the chemical stream. All recorded ratios were >20 (dashed line). Images in d and e were acquired with three trials for each side with a larva. Scale bars in d and e: 100 µm. f Left panel: the fluidic streams layout that was implemented during different periods of unilateral stimulus delivery (left-side stimulation illustrated). Right panel: visualization and monitoring of nasal stimulation by fluorescence imaging of 1 µM fluorescein in the vicinity of each OPs. Images show one trial for each case with a larva. Scale bar: 100 µm. Source data are provided as a Source Data file. |